

Binance US Trading Bot by 3Commas
MAR 9, 2022
9 MIN
Become a crypto master
Learn everything about crypto,
trading and bots

Start Trading on 3Commas Today
Get full access to all 3Commas trading tools with free trial period

In 2023, as the world of cryptocurrency trading continues to evolve, numerous traders lean on graphical analytics tools such as trading volumes, price movements, and various kinds of moving averages to plot trend lines and pinpoint pivotal market shifts. This article aims to deliver an in-depth exploration of the Golden Cross pattern, a highly regarded indicator in crypto chart analysis. We will dissect its critical stages and delve into the different types of moving averages that are used in constructing this pattern. Continue reading to elevate your trading skills and make the most out of employing the Golden Cross strategy in this dynamic market landscape.
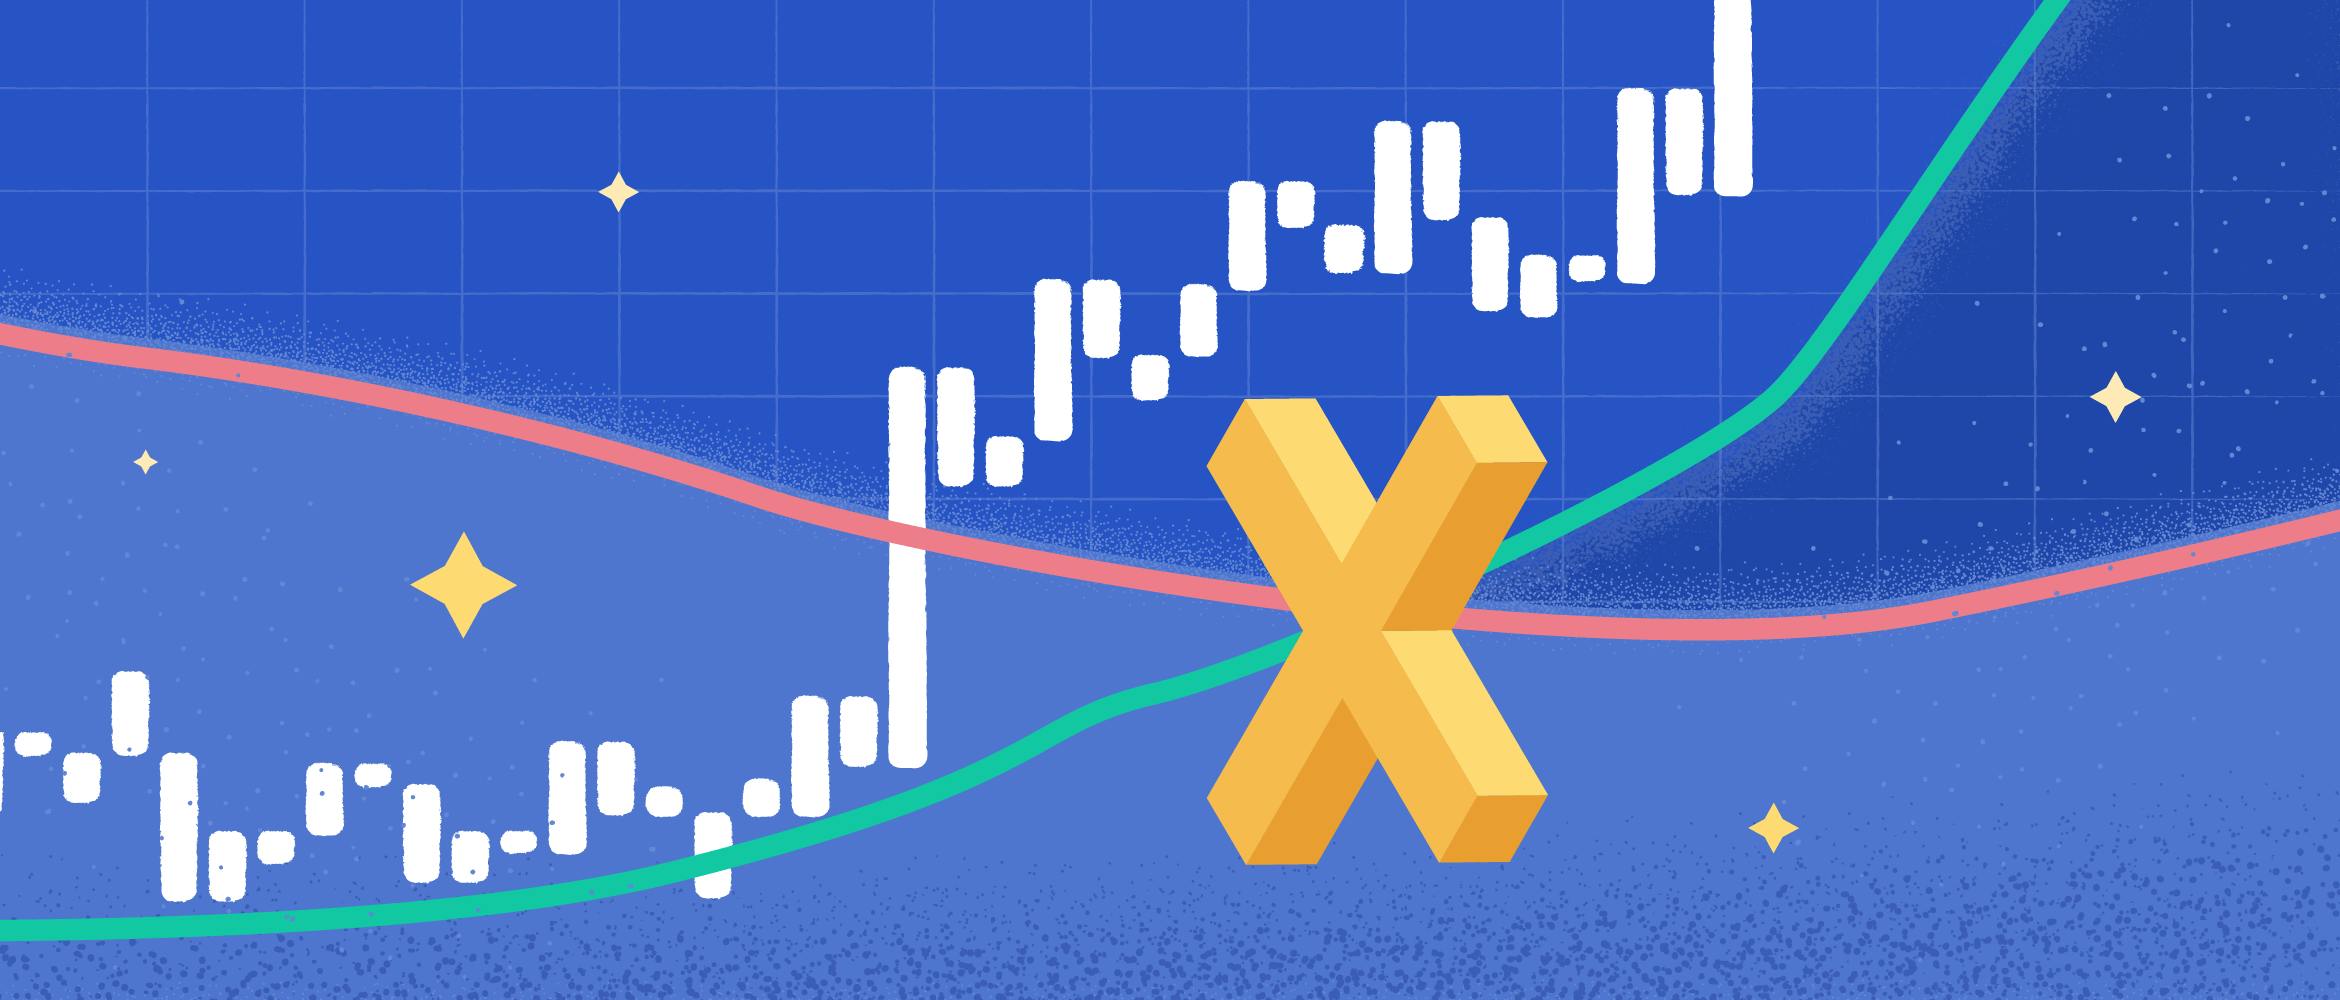
Golden Cross is a chart pattern that indicates the beginning of a strong uptrend on the given market. It appears at the crossover of moving averages (MAs) of shorter (usually 50-period) and longer terms (usually 200-period).
MA is a customizable technical indicator that sums up data points of the past time period and divides the total by the number of those points. It gives the traders an idea about potential changes in the market trends. As the name of these TAs implies, analysts always recalculate them using the latest data about prices.
The last stage of the golden cross is when the “Death Cross” occurs. In other words, when the short-term MA plunges under the long-term MA, the chart pattern of a death cross appears. The stages of this indicator are also diametrically opposite to those of the golden cross:
While both mentioned indicators confirm the beginning of the new long-term trend, death cross signifies that the prices will decline continuously, causing the bear market. Analysts consider it as the point of a sharp prices downturn, especially when high trading volumes accompany it. Thus, for investors, death cross is usually the signal for leaving the market. On the other hand, the point where the golden cross occurs signals the bull market. Predicted upcoming growth of prices is a good reason for entering the market.
Another difference is that after the death crossover, moving averages act as resistance levels. This is caused by the increasing number of sellers that prevent the price from going up.
In terms of 2023 "Golden cross" is the metric that uses data from the past time periods, which creates a “lag” effect. The interest of traders in the golden/death cross patterns definitely increased after the big crash of Bitcoin in 2021. After studying the charts, they revealed that the uptrend usually begins before the occurrence of the golden cross, which is always a missed opportunity for the investors that use it to enter the market.
Thus, as a lagging indicator, it doesn’t have reliable predictive power and sometimes leads to false positives and whipsaws (fastback and forth reversals). Especially within the crypto market, which is known for being extremely volatile. Prices can change in a matter of minutes. To take a long-term position efficiently, you need to consider more indicators.
While the golden cross pattern has its limitations, it’s still impossible to overlook its influence on the market.Golden cross chart patterns work the same for any cryptocurrency on the markets, which makes makes it possible to apply this indicator to crypto trading. Many investors rely on it, while purchasing their assets. Including major and meme coins, supporting the predicted bullish trend. The reaction of the market to the indicator is unavoidable to some extent — the indicator successfully fulfils itself.
MAs are one of the most commonly tracked chart indicators in cryptocurrency trading. Their main value is in measuring the momentum of the upcoming up- or downtrend. However, when it comes to relying on golden or death cross chart patterns in the Bitcoin trading game, many traders claim it’s the most efficient way for the long haul.
You should be familiar with the nuances of using the strategy, especially if you’re following the golden cross to get the most value out of it.
Let’s take a look at the different types of MAs and figure out how to use all of them efficiently. In fact, the trading results from using the golden cross pattern directly depends on the choice of the right MA.
The main types of moving averages:
The most reliable way to identify the direction of the price trend is to use short-term exponential moving average and long-term simple moving average, more precisely the 50-day EMA and the 200-day SMA.
According to this strategy, the best point to enter the buy is on the candle after the one that crosses above both MAs. Most trading charts provide the information on both 50 EMA and 200 SMA indicators.
The example below is 50 Day EMA. If you were using this technichal indicator on the given timeframe, the chances are your trading would be profitable, as the asset’s price was higher than the EMA most of the time.
Our next example is 200-day SMA. It’s much more smooth, as the name states. Statistically, it’s harder to go down this line, because the frame is longer and gives traders more info to consider. Trading deals using 200-day SMA are less profitable and more reliable, when compared to 50-day EMA. Choosing a risk profile is up to a trader. You can also combine different averages and use advanced technics like crosses.
While some experts claim that the “true” golden cross happens only when the 50-period MA crosses above the 200-period MA, the concept of the chart pattern is what matters the most. In fact, changing the definition of the short and long term MAs is crucial for identifying the price trend direction of such a volatile asset like Bitcoin. In some cases, the 10-day MA may be signaling the upcoming death cross, while the 50-day MA goes above the 200-day MA. Compare moving averages with different time frames to avoid fakeouts, which are especially common on the cryptocurrency markets.
The larger period the golden cross uses, the more obvious is the indication of the strong upward price trend. Shorter periods, starting with 5 minutes, are more commonly used by “day traders”, while longer periods have more value for “swing traders”.
Golden cross has more value in confirming the reversal of the trend that has already happened. It is essential to factor in other technical indicators and filters while making decisions on the market. Here are some of them:
Golden cross is a chart pattern that happens when a faster-moving average crosses a slower-moving one. It suggests the upcoming bull market with a consistent increase in prices. There are two main types of moving averages and the combination of 50-period EMA and 200-period SMA is the most efficient for volatile markets.
The indicator relies on the data of previous periods, which leads to the lag effect, meaning that it’s better for confirming the rise of the market rather than for predicting the beginning of the uptrend. The strategy of following the golden cross Bitcoin chart pattern requires factoring in additional metrics and filters if you use it for predicting the reversals of the market.

A proven leader, successful at establishing operational excellence and building high-performance teams with a sharp focus on value creation and customer success.