Meet your new crypto trading bots
Build your portfolio while you sleep using expertly engineered automated bots that deliver the performance elite traders demand with the simplicity new users need.
*No credit card required

3Commas helps traders win regardless of market conditions
For every market condition, there’s a trading strategy that can take advantage of it. 3Commas trade bots happen to be really good at reducing average acquisition costs, directly increasing your positive margins from each trade.
Bear markets
Use DCA Short bots to borrow and sell tokens at the current price and buy them back at a lower price
Bull markets
Use DCA Long bots to buy the natural dips and sell the spikes as the price rises over time, achieving a better average entry price for your positions
Sideways markets
Use Grid bots to pick up cheaper tokens when they hit support levels and sell them when they’re close to resistance levels
This is just a small sample of the many paths you can explore by leveraging the power of the 3Commas trading software.
Crypto is hard, but 3Commas makes it easier
Smart trading terminals with the ultimate feature set
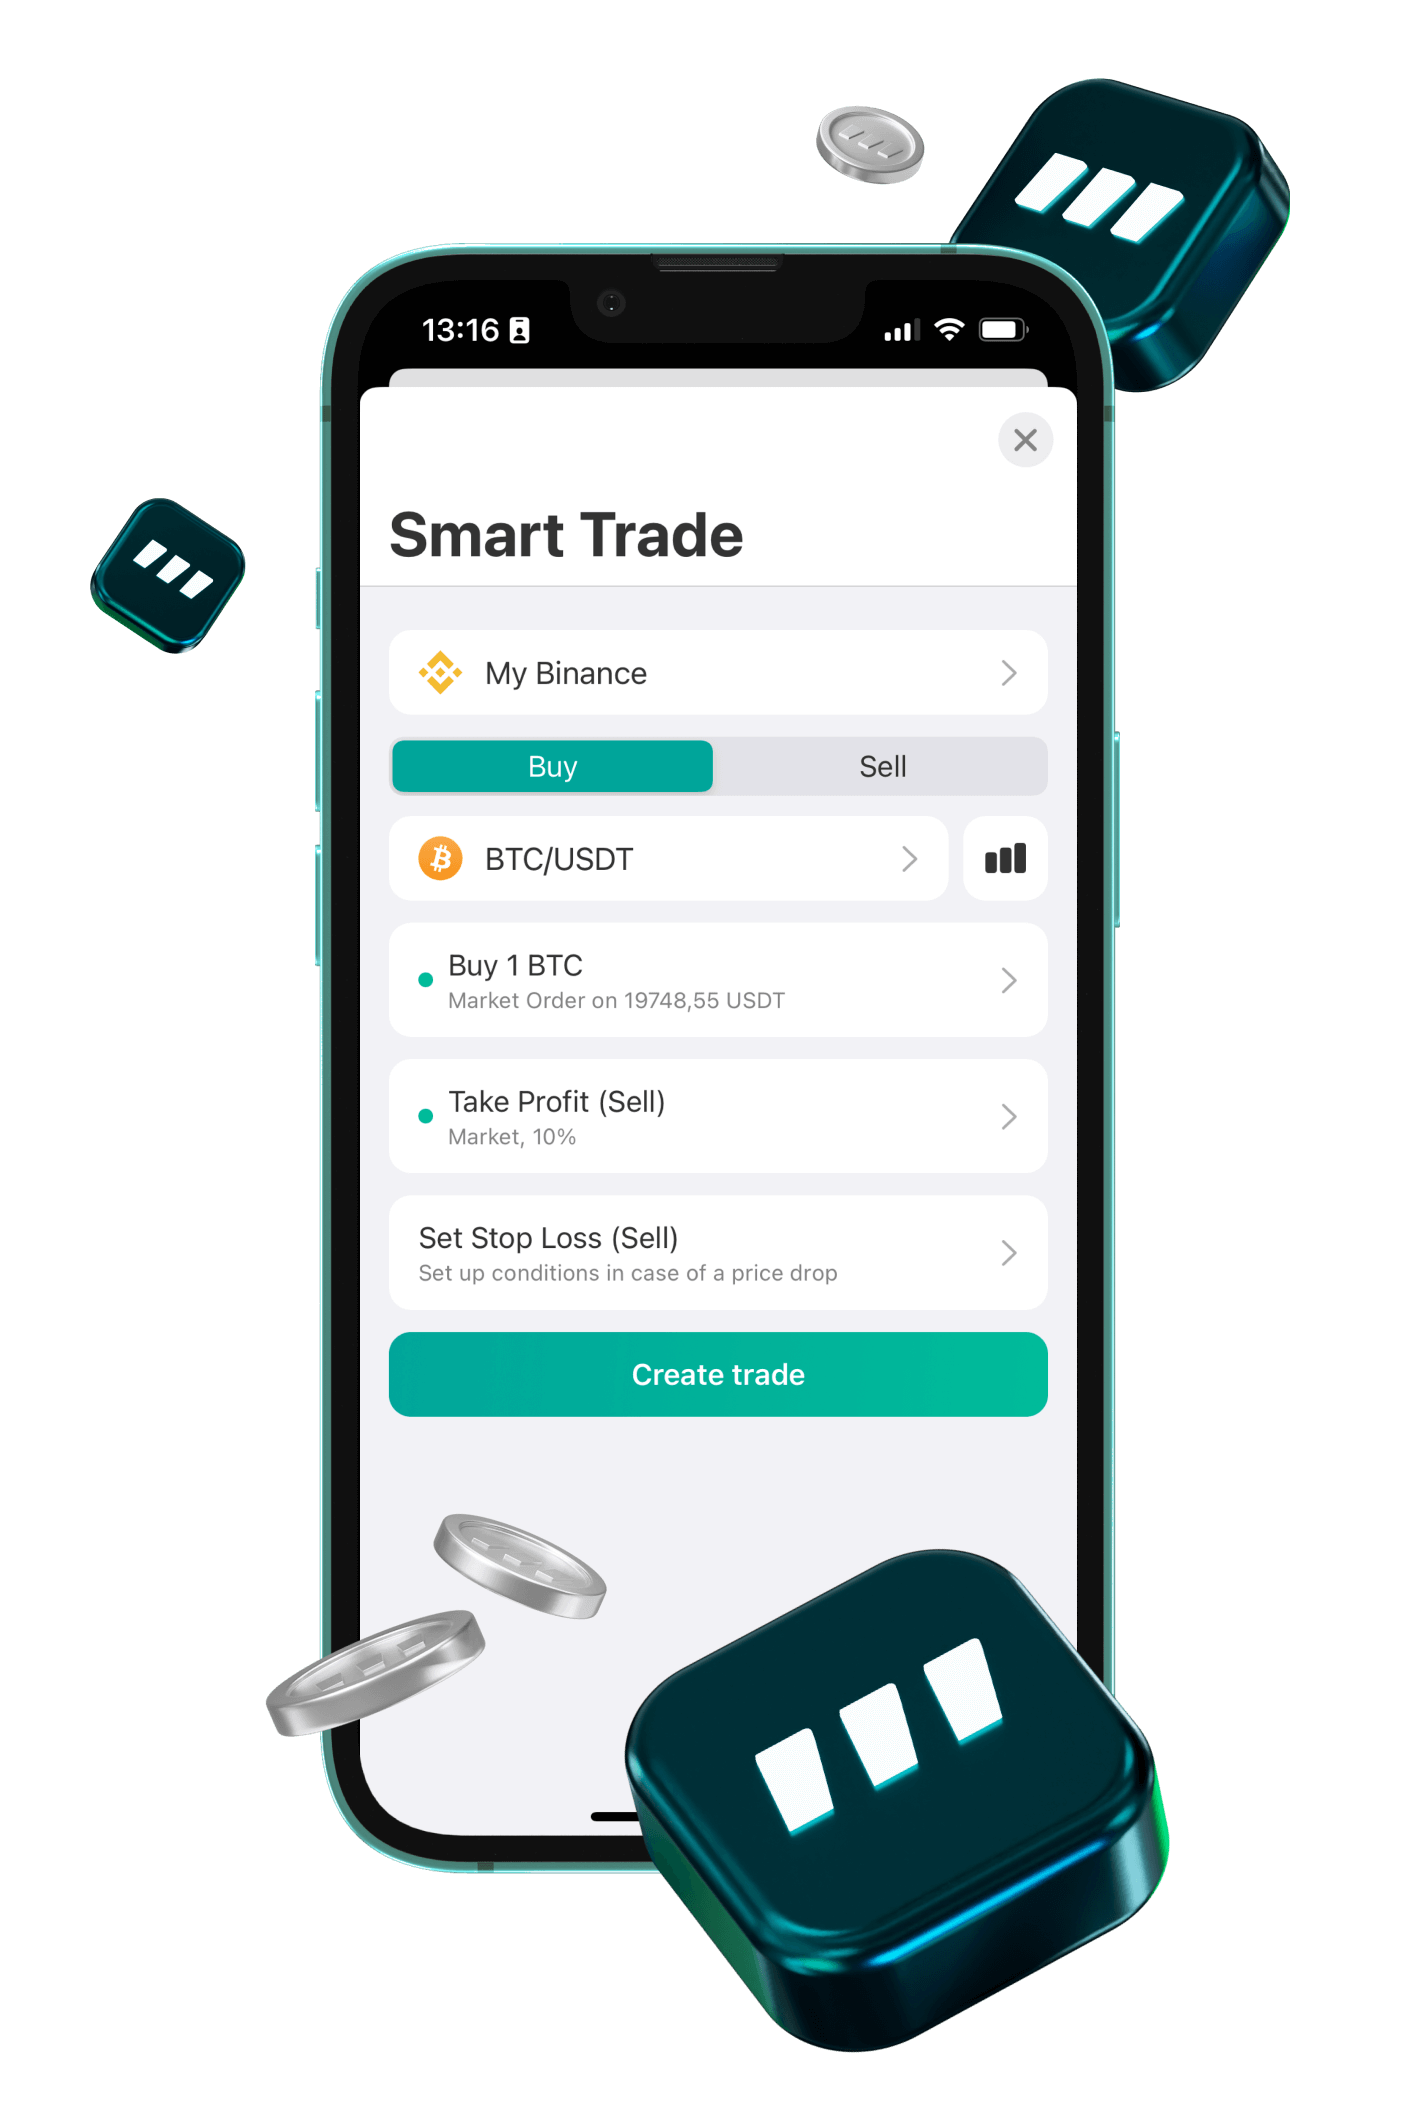
SmartTrade and Terminal enable you to set your trades in advanced based on triggers you specify. Set the trade, and walk away... 3Commas will handle it.
Track your performance
Keep your investments in one place, not all over the place.
Collect all your assets in one portfolio: connect exchanges and wallets, as well as create your own accounts for your favorite tokens and coins.

+31.41%PROFIT LAST MONTH
Bot presets
Not sure where to start? Copy the presets from other seasoned traders and skip the learning curve.

Signal bot (beta)
Cutting-edge solution, designed for users who want to seamlessly deliver TradingView indicators and strategies to cryptocurrency exchanges.

The right tools for every kind of market.

Security
3Commas only interacts with exchanges using API keys. We use Fast Connect and IP whitelisting to provide strong security.

Trade Automation
Our DCA, Grid, and Futures bots are proven performers that execute your trading strategy at scale. The market never sleeps, and neither do our bots

Analytics
3Commas’ dashboards show you exactly how your trades are performing, so you know when to optimize and when to let them run
Level up your trading game with advanced ai crypto trading tools that work on 14 of the biggest exchanges
Winning trades is the goal, and 3Commas is your all-in-one tool to achieve it. Integrating with most any exchange, 3Commas provides you the functions you wish you had and doesn't make you move your assets.
Manage all your exchange accounts from one interface
Automated trading tools are supported on 14 major cryptocurrency exchanges
Trade automation opens up new ways to seize opportunities
Unlike traditional stock markets, cryptocurrency markets operate 24 hours per day, 7 days per week. This is a point of fear for manual traders, but not for 3Commas users. Your ai crypto trading bots aren’t limited to Mon-Fri normal business hours to open deals. You can set up bots to operate under almost any contingency, whether it’s a flash crash or the market shooting to the moon. Sleep easy at night and let bots do the work.
Why do traders choose 3Commas?
“It’s a beautiful tool for making money, automated trading, and optimizing your crypto wallet management.”
"3Commas is one of the best services for automated trading on cryptocurrency exchanges."
"Great platform with clear presentation of your crypto's and DCA bots performance!"
3Commas features

Rebalancer
Create portfolios with any coin alocation and rebalance your account with a click.

Dashboard
Add multiple accounts to track your portfolio and check your daily PnL.

Demo account
Trade without money. Test strategies safely and without any risk.

Smart Cover
Accrue additional assets with unexpected market moves. Sell and buy back coins.

Signals
Subscribe to signals provided by other traders to copy strategies.
Manage your positions in one tap with the 3Commas mobile app
Download the mobile application, track strategy statistics, launch bots, and close orders. Whether you’re at home or on the road, manage your positions anywhere.
News and announcements
It's time to trade smarter
In partnership
with Binance
We recommend to use only proven trading services. We have been working with Binance since 2017, in October 2019 we became official partners
3Commas in the news

3Commas Becomes First Binance Broker Partner
bitcoinist.com

What is automated crypto trading and how does it work?
cointelegraph.com

Jump Crypto Lead $37M Funding for 3Commas Automated Crypto Trading Platform
coindesk.com

Largest Crypto Trading Bot and Investment Platform 3Commas Raises $37M
bloomberg.com

3Commas scores $37m for automated crypto trading bot platform
fintech.global

3Commas Review: Bitcoin & Cryptocurrency Trading Bot Platform
blockonomi.com
FAQ
Trade bots can have good performance when set up to use a trading strategy appropriate to market conditions. Using an automated crypto trading bot requires a basic understanding of current market trends and then matching a strategy to those trends. 3Commas offers a variety of proven templates created by professional users that can help new traders make well-performing crypto trading bots.
Bots trade crypto by automating the manual commands a user would normally make. They rely on triggers, referred to as signals, to tell them when to execute the buy and sell commands based on conditionals you select. Think of it as "if X, then Y." These signals monitor the price movement of coins based on API connections with the crypto exchange, and then follow your commands when the market conditions are met. Multiple signals can be used to create complex trading strategies that are very difficult to execute manually. Common automated trading bots are DCA bots, Grid bots, Futures bots, Options bots, Arbitrage bots, and HODL bots.
Using a cryptocurrency trading bot is the best way to trade crypto if you plan on doing anything other than buying and holding. The bots never sleep and they can execute your strategy 24/7 so that you are not stuck at a computer inputting a lot of manual commands. Using a bitcoin trading bot, for example, allows you to automate buying the lows and selling the highs when the market is dynamic. Using bots to trade crypto allows you to have your assets working for you to seek opportunities and increase the value of your portfolio rather than sitting in storage.
This depends on several factors, such as the trading fees imposed by a supported brokerage such as Coinbase pro. Using an altcoin trading bot on a trading platform will typically require a monthly subscription fee between $14-50 depending on the number and type of bots you will be using. Trading fees on a crypto exchange are charged with each trade, which can make some high-frequency trading strategies unviable on exchanges with higher fees.
A trader can make considerable portfolio growth conducting bitcoin trading or altcoin trading if they're using the right strategies and settings. A proficient trader measures success by percentage earned from their average trades, rather than raw totals. It’s not uncommon for experienced traders to average between 15-25% in the green over the many crypto trades they do each week. New users will likely experience lower success percentages as they learn more about how to do technical analysis of the market and how to fine-tune their bots to get better performance.
Automated trading has already been proven to work over the course of millions of bot trades. The key thing is to choose a reliable trading software that features cryptocurrency trading bots with proven track records. The software should also be very transparent with performance data so you have the information you need to create a solid trading strategy. Automated trading works well when users pair a bitcoin trading bot or altcoin trading bot with a good strategy and third party signals on a crypto exchange with reasonable fees.
There are many market conditions where holding is not a good strategy. If the market is rapidly going down, a bot that sells your assets and then buys them back at a lower price can result in significant gains to your portfolio when the market recovers. When the market is flat, a Grid bot can take advantage of daily fluctuations to potentially grow your portfolio slowly over time rather than having your coins in cold storage doing nothing.To set up a cryptocurrency trading bot, a trader needs to make a few decisions. First, which type of bot do you want to use? Then you need to pick which crypto exchange you want to use. Next, you need to decide which trading rules to configure the bot with. This includes the creation of a strategy that will determine how the bot trades, as well as choosing signals that determine when the bot trades. Alternatively, you can choose a preset template that has all of these trading rules locked in already, greatly simplifying the experience for the user.
Most crypto trading softwares offer a free option that includes 1-2 DCA or Grid bots. This is a low or no-cost way to learn the software, but most traders will want to upgrade to a paid plan that offers more bots so you can execute your trading strategies more effectively. Typically you can sign up for paid subscriptions using a credit card, debit card, or even pay with Bitcoin, Ethereum or some other stablecoin or altcoin.
There may be an issue with your payment method, in which case you should contact our support team for assistance. If you are a resident of a country that is currently on the sanctions list for the European Union, Republic of Estonia, or other nations and international organizations listed under section 26 of our Terms of Use (Client Terms of Use), 3Commas is not able to offer you any kind of paid services, which includes 3Commas subscription plans.


