
The Rise of the Anon Dev: Crypto Marketing in 2021
APR 28, 2021
5 MIN
Become a crypto master
Learn everything about crypto,
trading and bots

Start Trading on 3Commas Today
Get full access to all 3Commas trading tools with free trial period

The RSI indicator was developed over four decades ago by the stock trader Welles Wilder. In 1978, he first published the results of his work in Commodities magazine. Since then, the RSI indicator has become very popular among traders and investors around the world. The reason behind the indicator’s success lies in its ability to accurately determine the strength and reversal potential of the price trends. Today we will review the principles of this indicator and its practical application.
The Relative StrengthIndex ( RSI) is a technical analysis indicator that determines the strength of a trend and its reversal probability. RSI is one of the most popular indicators among traders due to its high accuracy and simplicity of interpretation.
RSI is an oscillator, which means that its value varies between 0 and 100. Depending on these values, we can define whether an asset is overbought or oversold. Moreover, the RSI indicator’s direction may differ from the price movement direction, which signals divergence. Divergence is a strong signal of a trend’s reversal.
Popular trading terminals, such as Tradingview, have automatically built in RSI’s, but to understand how the indicator works, we need to know what formula underlies the calculation. Calculation of RSI is a two-step process, which involves measuring the relative strength of the price trend (RS) by comparing the average value of price rise (profit) to the average value of price fall (loss) for the chosen period.
First, we need to calculate the RS. To do this, we select the 14 Japanese candlesticks on the chart preceding the current period. Of those closed above the opening price, we determine the average value of price growth (average growth divided by the period taken, i.e., by 14). The average value of the price drop is determined similarly. Thus, the first step is to obtain the RS value, i.e., the ratio of the indicators mentioned above.
We use the obtained value of RS in the following formula:
Keep in mind that all calculations are performed automatically, and with a sufficient amount of historical data (preceding Japanese candlesticks on a certain scale), RSI takes the form of a smooth curve, which fluctuates between 0 and 100. For example, this is what the RSI indicator looks like on the 4H Bitcoin chart:
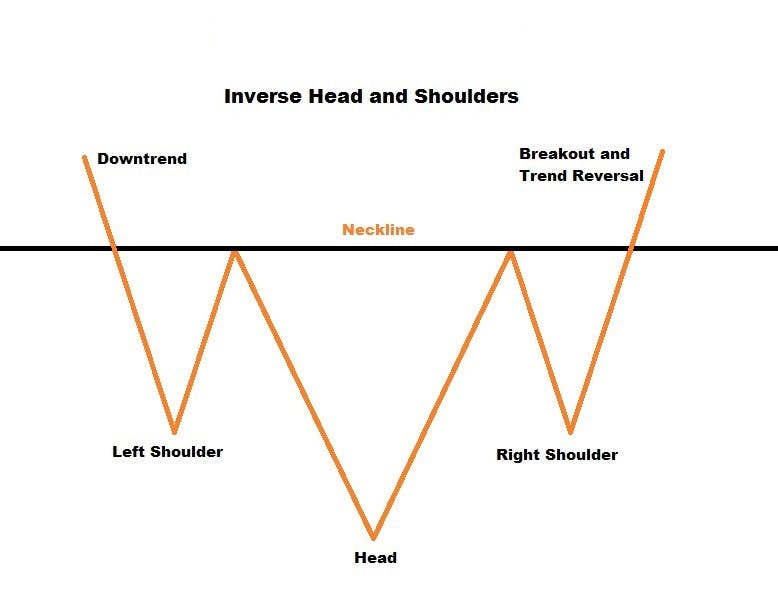
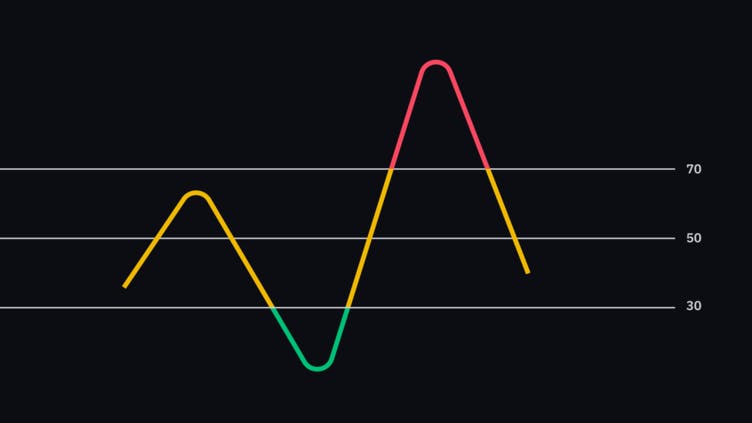
The RSI zone is often divided by two lines at the 70 and 30 levels. They indicate the asset’s overbought and oversold zones. The indicator itself often forms technical analysis patterns, which we will review further below.
RSI is one of the main tools for determining the strength of the trend. This indicator can signal a trend reversal even before the price of an asset makes a move. That is why it is best to use RSI during a distinct trend. When the price is moving in a horizontal channel, RSI is not that useful and can often provide false signals.
RSI can also help determine the trend. To take advantage of this feature, we need to introduce an average value of 50 to the indicator. If the indicator’s readings fluctuate mostly below the average value, we are in an ongoing downtrend, and if the readings are above average, we are dealing with an uptrend. For example, here is a 4H Bitcoin chart from January 28th to February 22nd. During that time, the cryptocurrency price rose from about $31,000 to $57,000, and the RSI indicator fluctuated above its average values.
An example of the downtrend can be observed between February 22nd and March 1st when Bitcoin fell from 56,000 to 43,000 USD:
The RSI also helps determine trend reversal or at least its short-term change by utilizing the overbought/oversold zones. It is quite simple: if the RSI falls to or below its 30 mark, there is a high probability for the asset to grow, and vice versa, the rise to or above the 70 mark indicates a possible price drop.
However, do not forget that fluctuations of the indicator in the zones mentioned above do not guarantee the asset’s fall or rise. RSI can reach the overbought zone and stay in that zone for an extended period of time in case the trend is really strong.
Another common use of RSI is detecting divergences — differences in the direction of the indicator and the price itself. There are two types of divergence:
A bullish divergence takes place when a downtrend is about to turn into an uptrend; it often occurs after a relatively long fall in the asset’s price. Divergence predicts a trend reversal with high probability only in case of an existing trend; otherwise (if the price moves in a horizontal channel), the divergence is often a false signal. Therefore, in order to identify a bullish divergence, look for divergences in the formation of local lows between the chart and the indicator, similar to what is shown on the screenshot below:
Above, you can see a bullish divergence, which took place on December 9th. The price formed lower local lows, while the local lows on the indicator were forming higher. This indicated a strong trend reversal signal and Bitcoin’s price shortly started to grow.
Hidden bullish divergence is also worth mentioning; it occurs when the price forms higher local lows, but the indicator continues to reach lower lows. See the example on the chart below:
Sometimes a hidden bullish divergence is formed on the backdrop of the continuing price growth. That means it does not even have to be preceded by a downtrend.
Finally, the last example is a relatively weak bullish divergence. The price forms two almost identical local lows, while the indicator forms the second higher low.
Keep in mind that the higher the timeframe, the more reliable divergence signals are.
This RSI signal is directly opposite to the bullish divergence. The difference lies in considering local highs instead of local lows, as we did before when searching for the bullish divergence. Here is an example of a clear bearish divergence when the price forms a higher high, which coincides with the divergence formed by the indicator:
Also, see the hidden bearish divergence, while the price decreases and the indicator forms a higher high:
And finally, the last type of bearish divergence is when the price continues to move upwards, while the indicator forms a double top.
This may seem like a lot of information in a single article, so we’d like to share a cheat sheet with you to navigate an array of possible scenarios:
Keep in mind that strong trends may sometimes ignore the formation of a single divergence; hence the trend may not always immediately reverse. Three bullish divergences were formed in a row on the chart below, yet trend reversal did not occur.
It is worth noting that trading should not be based solely on the RSI readings; this can often turn out to be unprofitable. RSI should be used in combination with other tools such as support/resistance levels, moving averages, Fibonacci retracements, etc.
The Relative Strength Index is arguably the most popular trading tool. Over the years, it has proven its reliability in analyzing both traditional markets and the cryptocurrency market. It is an excellent tool for determining the trend and its reversal potential, vital for every trader.

A proven leader, successful at establishing operational excellence and building high-performance teams with a sharp focus on value creation and customer success.