


Circulating Supply
2025년 7월 1일
Trustpilot
4.5 out of 5
Capterra
4.5 out of 5
G2
4.5 out of 5
4.2 out of 5
트레이더 등록
연결된 거래소 계정
출시 전 백테스트된 전략
실행된 전략
자동 거래로 스트레스와 감정적 실수를 줄이세요.
원하는 대로 전략을 실행하도록 봇을 설정하세요.
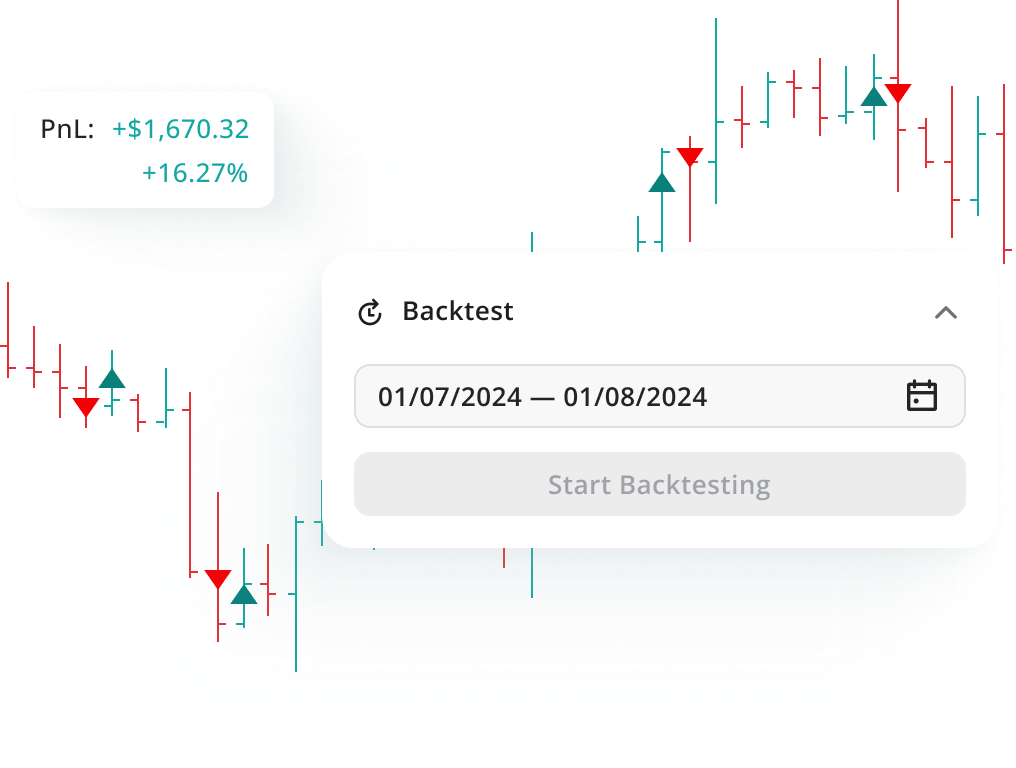
1분 간격의 과거 데이터를 최대 1년간 백테스트하세요.
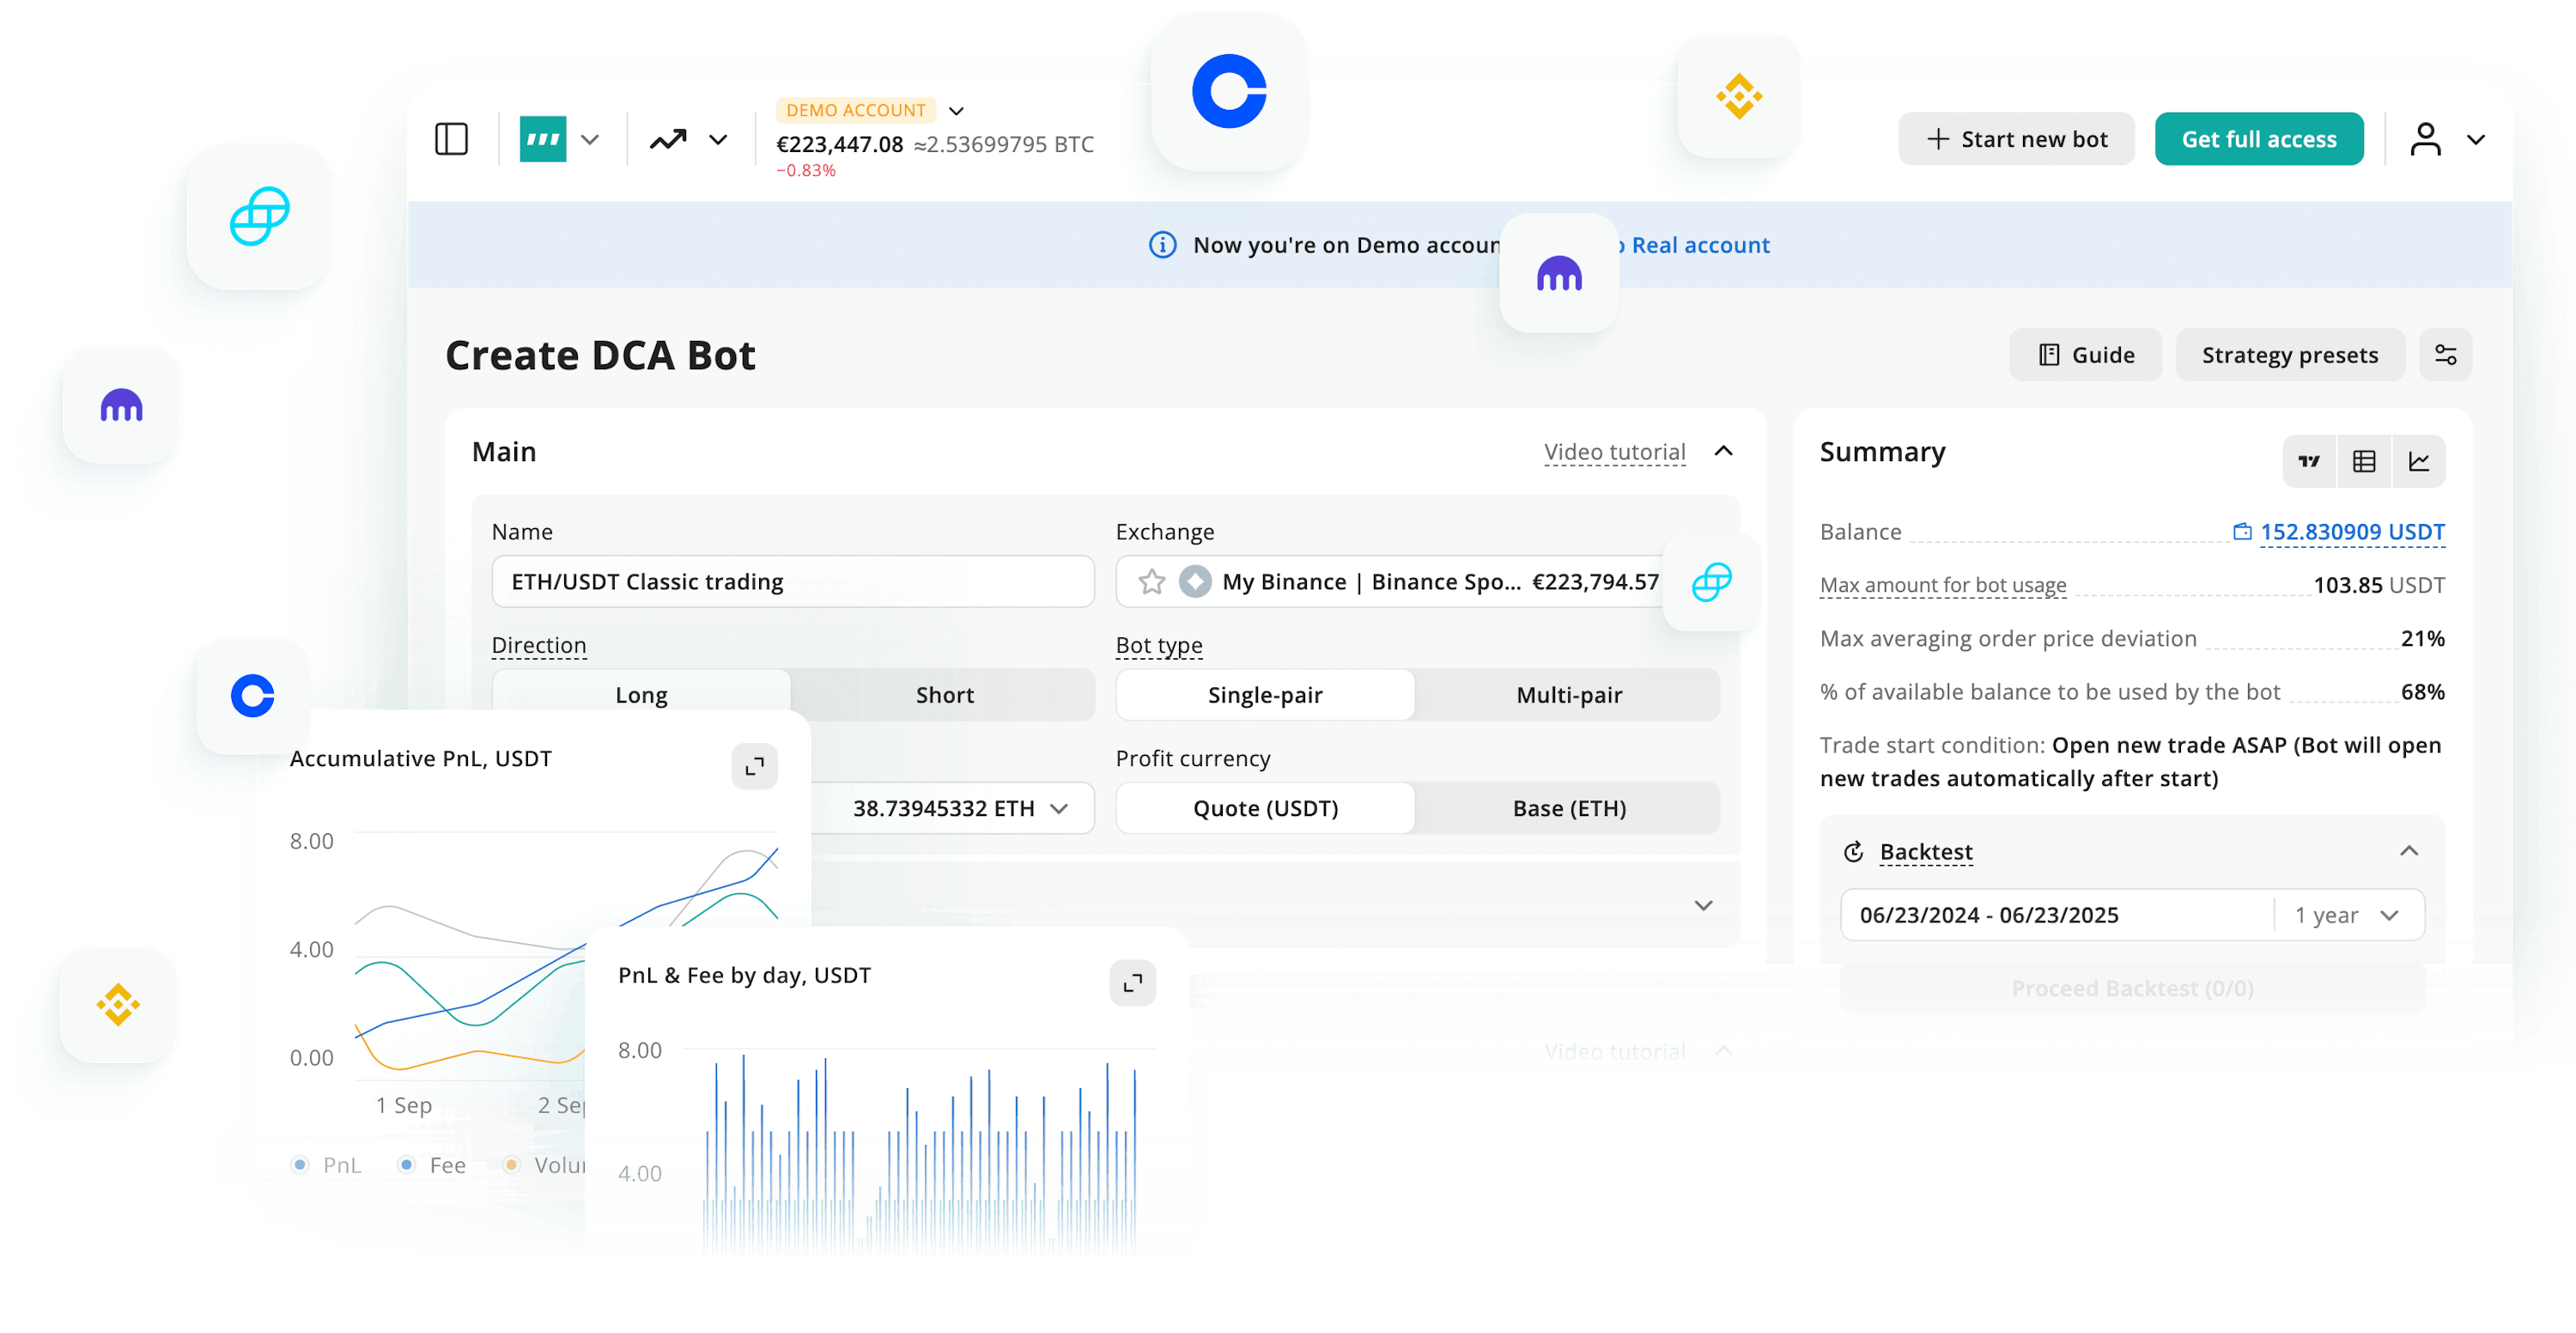
자동 거래 봇을 만들고, 실제 시장 기록에서 테스트하고, 안심하고 계정을 거래할 수 있게 하세요
3Commas를 통해 전략을 정밀하게 자동화하여 포트폴리오 확장에 집중할 수 있습니다
바로 사용 가능
시간의 검증을 거친 백테스트된 전략을 복사하세요.
Bybit
ROI
10.6%

PnL
$4,352.00
Win Rate
73%
Trades Closed
22
Max. floating drawdown
-2.10%
Total Fees
$67.49
Binance Futures
ROI
3.8%

PnL
$2,587.00
Win Rate
98.93%
Trades Closed
93
Max. floating drawdown
-18.51%
Total Fees
$31.04

Kraken
ROI
12.1%

PnL
$4,088.00
Win Rate
67.13%
Trades Closed
366
Max. floating drawdown
-4.51%
Total Fees
$81.33

Coinbase
ROI
8.4%

PnL
$5,247.00
Win Rate
100%
Trades Closed
13
Max. floating drawdown
-1.51%
Total Fees
$51.44

OKX
ROI
4.2%

PnL
$2,871.00
Win Rate
81.08%
Trades Closed
37
Max. floating drawdown
-7.20%
Total Fees
$23.83
Bybit
ROI
10.6%
PnL
$4,352.00
Win Rate
73%
Trades Closed
22
Max. floating drawdown
-2.10%
Total Fees
$67.49
Binance Futures
ROI
3.8%
PnL
$2,587.00
Win Rate
98.93%
Trades Closed
93
Max. floating drawdown
-18.51%
Total Fees
$31.04
Kraken
ROI
12.1%
PnL
$4,088.00
Win Rate
67.13%
Trades Closed
366
Max. floating drawdown
-4.51%
Total Fees
$81.33
Coinbase
ROI
8.4%
PnL
$5,247.00
Win Rate
100%
Trades Closed
13
Max. floating drawdown
-1.51%
Total Fees
$51.44
OKX
ROI
4.2%
PnL
$2,871.00
Win Rate
81.08%
Trades Closed
37
Max. floating drawdown
-7.20%
Total Fees
$23.83
모든 시장을 지배할 수 있는 트레이딩 봇으로 금융 미래를 구축하세요
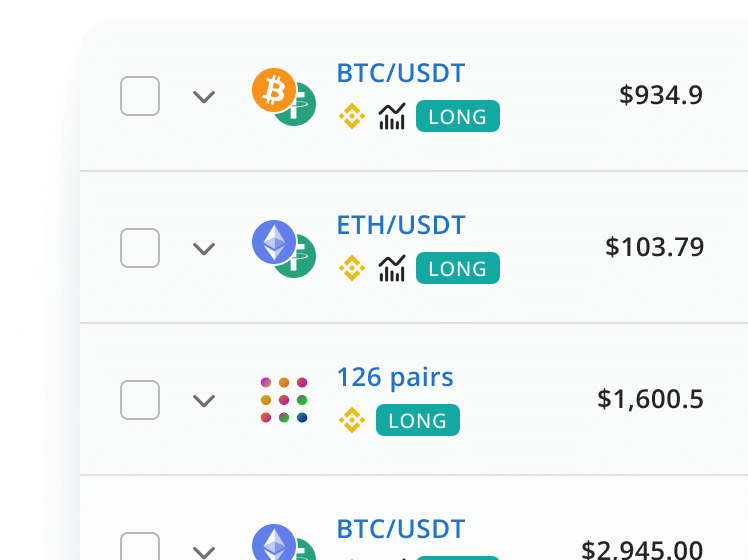
이 봇은 3Commas 내에서 가장 유연하고 구성이 가능하며, 사용자가 고유한 전략에 맞게 사용자 지정할 수 있는 다양한 설정을 제공합니다. 멀티 페어 봇은 100개 이상의 페어를 모니터링하여 조건에 맞는 최적의 거래를 찾을 수 있습니다.
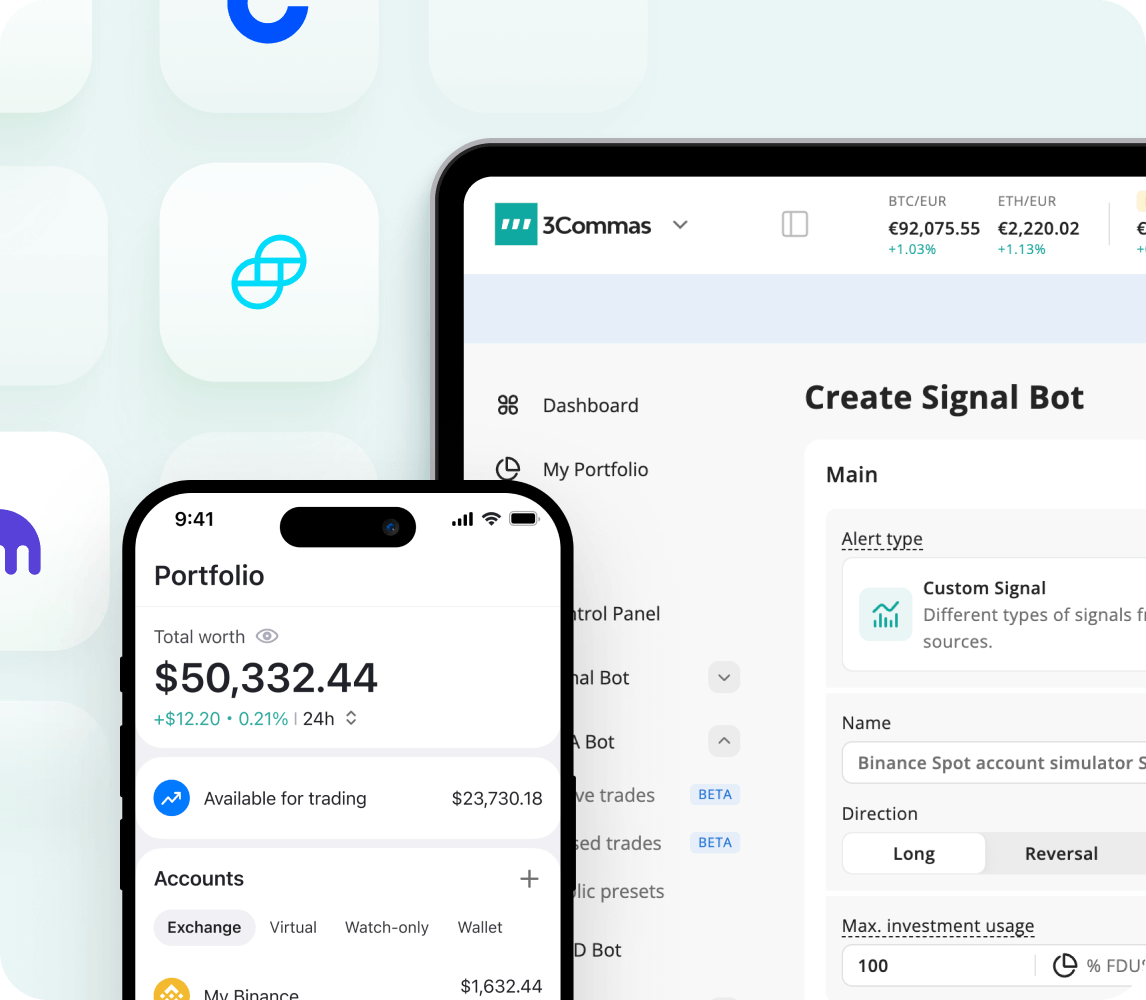
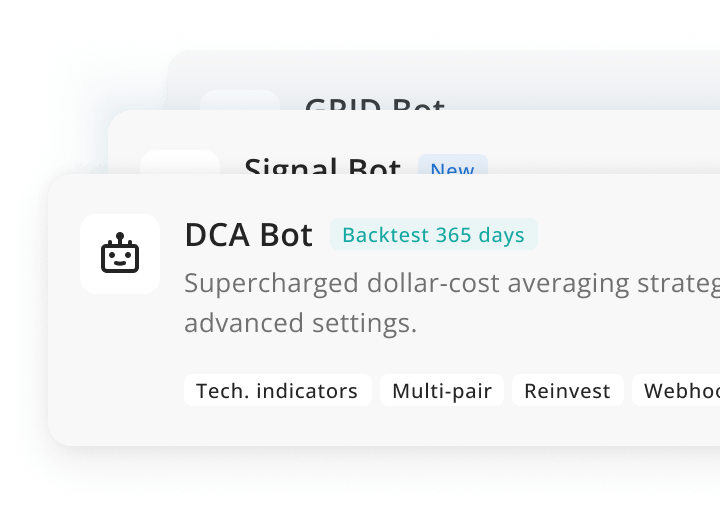
DCA 봇 소개TradingView에서 얻은 최고의 정보를 봇으로 전환하세요. 시그널 봇을 사용하면 동일한 봇으로 매수 및 매도 포지션 거래와 같은 고급 전략은 물론 스마트 트레이딩 통합을 통한 추가 거래 제어가 가능합니다.
시그널 봇 소개프로 트레이더는 일관성 있는 설정과 유지 관리가 필요 없는 기능을 좋아합니다. 이 AI 봇은 가격 추세가 지속적으로 횡보하는 시장에서 정말 탁월합니다. 이 봇은 작은 성공 거래를 많이 하는 방식으로 작동합니다.
GRID 봇 정보거래를 세밀하게 제어해 원하는 가격에 체결할 수 있습니다. 추적 손절매, 추적 손절매, 다중 손절매를 사용하여 모든 거래소에서 하나의 인터페이스에서 거래 수익률을 높일 수 있습니다.
스마트 트레이딩 소개연결된 모든 거래소에서 일회성 거래 기회를 빠르게 포착하고 스캘핑하세요. 터미널은 지정가 및 시장가 주문을 빠르게 수동으로 거래할 수 있는 원스톱 액세스 포인트입니다.
터미널 정보
수동 트레이더가 놓칠 수 없는 기회 포착
공식 Fast Connect 통합을 통해 또는 API 키를 사용하여 수동으로 거래소 계정을 연결하세요.
당신을 신뢰하는 팔로워가 있나요? 함께 협업하고, 그들이 좋아할 콘텐츠를 공유하며 수익을 올리세요.
제휴사 되기진화하는 위협에 대응하기 위해 선제적으로 보안 조치를 강화합니다.
3Commas는 회원님의 거래소 계정에 액세스할 수 없으며 자금을 출금할 수 없습니다.
저희 소프트웨어는 엄격한 규정을 준수하므로 안심하고 사용할 수 있습니다.
평점
Excellent
on
1,479 리뷰
3Commas에서의 백테스트는 삶을 더 쉽게 만들어 줍니다. 돈을 잃지 않고도 아이디어를 시험해보고, 어떤 것이 효과가 있는지 확인하고, 어리석은 실수를 피할 수 있습니다. 더 많은 백테스트를 하기 위해 전문가 플랜을 구입했습니다.
오랫동안 수익성이 있다고 생각되는 전략을 사용했지만 장기적으로 보면 서서히 돈을 잃고 있었습니다. 3Commas의 백테스트 기능을 통해 수익을 창출하는 트레이더가 되려면 전략을 조금만 변경하면 된다는 것을 깨달았습니다.
저는 몇 년 동안 3Commas를 사용해 왔는데, 이 강력한 봇의 메커니즘을 이해하면 최소한의 위험으로 좋은 수익을 창출할 수 있습니다(저는 적은 위험과 레버리지 없이도 15~30%의 연 수익을 올리고 있습니다). 잠자는 동안에도 수익을 올릴 수 있고 발전하면서 계속 배울 수 있습니다.
지난 4년 동안 3Commas를 사용해 왔습니다. 시중에 나와 있는 거의 모든 DCA 봇 도구를 사용해 보았는데, 지금까지 3Commas가 가장 좋았습니다. 가장 큰 장점은 3Commas가 사용자 지정 시그널로 멀티 페어 컴포지트 DCA 봇을 제공하는 유일한 소프트웨어라는 점입니다.
다른 트레이딩 봇도 사용해봤지만 이 봇이 훨씬 낫고 손실을 관리하고 수익을 극대화할 수 있었습니다. 앞으로도 계속 사용할 예정입니다.
저는 암호화폐 거래가 처음인데 3Commas를 쉽게 사용할 수 있었습니다. 페이퍼 트레이딩을 통해 많은 것을 배웠고 사이트 이용에 안전하다고 느낍니다.
새로운 전략 혁신에 집중하는 동안, 지루한 작업은 저희 기술에 맡기세요.
신용 카드 필요 없음
의무 사항 없음
숨겨진 수수료 없음
백테스트는 과거 데이터에 대한 거래를 즉시 시뮬레이션합니다. 페이퍼 거래는 현재 시장 상황을 사용하여 실시간으로 거래를 시뮬레이션합니다.
백테스트는 사용하는 데이터와 로직의 정확도에 따라 달라집니다. 미래를 예측할 수는 없지만 전략이 과거 시장 상황에서 어떻게 성과를 냈을지 보여줍니다. 이는 위험 통제와 개선을 위한 최고의 출발점입니다.
자동화된 봇은 다양한 전략을 구현하고 미세 조정하여 사용자가 리소스를 보다 효과적으로 할당할 수 있도록 도와줍니다. 사용자는 봇을 어떤 트레이딩 전략으로 구성할지 결정해야 합니다. 여기에는 봇이 작업을 실행하기 위한 타이밍 및 명령에 대한 전제 조건을 선택하는 방법에 대한 일련의 규칙을 개발하는 것이 포함됩니다. 봇은 항상 선택한 전략에 따라 작동하며, 이는 사용자가 달성할 수 있는 성공 수준을 정의합니다. 전략을 적용하기 전에 데모 계정을 사용하여 연습하는 것이 좋습니다.
봇은 일반적으로 사용자가 수동으로 수행하던 작업을 자동화합니다. 봇은 사용자가 지정한 조건에 따라 매수 및 매도 명령을 실행할 시기를 알려주는 트리거(시그널이라고도 함)에 의존합니다. 이러한 시그널은 암호화폐 거래소와의 API 연결을 기반으로 코인의 가격 변동을 모니터링한 다음 시장 조건이 충족되면 사용자 명령을 따릅니다. 여러 시그널을 사용하여 수동으로 실행하기 매우 어려운 복잡한 트레이딩 전략을 만들 수 있습니다. 일반적인 트레이딩 봇은 DCA 봇, 그리드 봇, 선물 봇, 옵션 봇, 차익 거래 봇, HODL 봇입니다.
암호화폐 트레이딩 봇을 사용하는 것은 매수 및 보유 이외의 다른 목적으로 암호화폐를 거래할 계획이라면 가장 좋은 방법입니다. 봇은 지속적으로 활성화되어 24시간 내내 전략을 실행하므로 컴퓨터에서 수많은 명령을 수동으로 입력해야 하는 번거로움이 없습니다. 예를 들어 비트코인 트레이딩 봇을 사용하면 시장이 역동적일 때 자동으로 저점 매수 및 고점 매도를 할 수 있습니다. 봇을 사용하면 자산을 보관소에 두지 않고 기회를 찾아 포트폴리오의 가치를 높일 수 있습니다.
트레이더가 올바른 전략과 설정을 사용하면 비트코인 또는 알트코인 거래를 통해 상당한 포트폴리오 성장을 이룰 수 있습니다. 트레이딩 경험과 전략에 따라 많이 달라집니다. 공격적인 트레이딩을 하면 수익은 더 높지만 그에 상응하는 위험도 커집니다. 차분하게 거래하면 수익은 낮지만 그에 상응하는 위험도 줄어듭니다. 신규 사용자는 기술적 시장 분석 방법과 봇을 미세 조정하여 더 나은 성능을 얻는 방법에 대해 더 많이 배우면서 성공률이 낮아질 가능성이 높습니다.
자동 트레이딩은 이미 수백만 개의 트레이딩 봇을 통해 효과가 입증되었습니다. 핵심은 실적이 입증된 암호화폐 트레이딩 봇을 갖춘 신뢰할 수 있는 전략과 트레이딩 소프트웨어를 선택하는 것입니다. 또한 소프트웨어는 성과 데이터를 매우 투명하게 공개하여 견고한 트레이딩 전략을 세우는 데 필요한 정보를 제공해야 합니다.
보유가 실행 가능한 전략이 아닌 시장 상황이 많이 있습니다. 시장이 급락하는 경우 자산을 매도한 후 더 낮은 가격에 다시 매수하는 전략은 시장이 회복될 때 사용자 포트폴리오에 상당한 이익을 가져다줄 수 있습니다. 시장이 보합세를 보일 때 그리드 봇은 일일 변동을 활용하여 코인을 콜드 스토리지에 아무것도 하지 않고 방치하는 대신 시간이 지남에 따라 사용자 포트폴리오를 천천히 성장시킬 수 있습니다. 3Commas는 매수 후 보유 전략과 자동매매 방식을 사용할 수 있는 기술을 제공합니다. 사용자는 어떤 전략을 사용할지 선택합니다.
봇을 설정하려면 사용자는 몇 가지 중요한 결정을 내려야 합니다. 먼저, 사용자는 사용할 봇 유형을 결정해야 합니다. 그런 다음 제한된 범위의 권한으로 암호화폐 거래소 계정을 3Commas에 연결합니다. 마지막으로 사용자는 거래 규칙을 구성하고 봇의 전략을 선택합니다.
대부분의 암호화폐 트레이딩 소프트웨어는 1~2개의 DCA 또는 그리드 봇이 포함된 무료 옵션을 제공합니다. 이는 저렴하거나 무료로 소프트웨어를 배울 수 있는 방법이지만, 대부분의 트레이더는 더 많은 봇을 제공하는 유료 플랜으로 업그레이드하여 트레이딩 전략을 더 효과적으로 실행할 수 있습니다. 일반적으로 신용카드 또는 직불카드를 사용하여 유료 구독을 신청하거나 비트코인, 이더리움 또는 기타 스테이블코인 또는 알트코인으로 결제할 수 있습니다. 3Commas에는 세 가지 유형의 구독 요금제가 있습니다: 무료 요금제, 프로 요금제, 전문가 요금제입니다.
결제 방법에 문제가 있을 수 있으며, 이 경우 지원팀에 문의하여 도움을 받으셔야 합니다. 3Commas는 현재 유럽연합 공화국 또는 기타 국가 및 국제기구의 제재 목록에 등재된 국가의 거주자인 사용자에게는 3Commas 구독 요금제를 포함한 어떠한 종류의 유료 서비스도 제공할 수 없습니다(고객 이용약관).
AI 그리드 봇은 고객 자산 안전성을 높이고 청산 위험 가능성을 없애기 위해 노력합니다. 검증된 그리드 트레이딩 전략에 AI를 결합하여 자율적으로 저점 매수 및 고점 매도를 하면서 잠재적으로 수익을 극대화하고 위험을 최소화하기 위해 지속적으로 포지션을 수정하는 3Commas AI 그리드 봇을 만들었습니다.
3Commas 봇의 경우 시장 상황은 제한 요소가 아니며, 강세장과 약세장 모두에서 작동할 수 있습니다. DCA 및 그리드와 같은 봇은 사용자의 설정과 전략에 따라 조정됩니다. 시그널 봇은 사용자 정의 전략 또는 보조지표가 이미 구성된 TradingView와 통합할 수 있습니다.


