


Circulating Supply
1 jul 2025
4.5 out of 5
4.5 out of 5
4.5 out of 5
4.2 out of 5
Traders registrados
Cuentas de exchange conectadas
Estrategias probadas antes de lanzarlas
Estrategias ejecutadas
Listo para usar
Copia una estrategia con backtest, probada y validada por el tiempo.
Bybit
ROI
10.6%

PnL
$4,352.00
Win Rate
73%
Trades Closed
22
Max. floating drawdown
-2.10%
Total Fees
$67.49
Binance Futures
ROI
3.8%

PnL
$2,587.00
Win Rate
98.93%
Trades Closed
93
Max. floating drawdown
-18.51%
Total Fees
$31.04

Kraken
ROI
12.1%

PnL
$4,088.00
Win Rate
67.13%
Trades Closed
366
Max. floating drawdown
-4.51%
Total Fees
$81.33

Coinbase
ROI
8.4%

PnL
$5,247.00
Win Rate
100%
Trades Closed
13
Max. floating drawdown
-1.51%
Total Fees
$51.44

OKX
ROI
4.2%

PnL
$2,871.00
Win Rate
81.08%
Trades Closed
37
Max. floating drawdown
-7.20%
Total Fees
$23.83
Bybit
ROI
10.6%
PnL
$4,352.00
Win Rate
73%
Trades Closed
22
Max. floating drawdown
-2.10%
Total Fees
$67.49
Binance Futures
ROI
3.8%
PnL
$2,587.00
Win Rate
98.93%
Trades Closed
93
Max. floating drawdown
-18.51%
Total Fees
$31.04
Kraken
ROI
12.1%
PnL
$4,088.00
Win Rate
67.13%
Trades Closed
366
Max. floating drawdown
-4.51%
Total Fees
$81.33
Coinbase
ROI
8.4%
PnL
$5,247.00
Win Rate
100%
Trades Closed
13
Max. floating drawdown
-1.51%
Total Fees
$51.44
OKX
ROI
4.2%
PnL
$2,871.00
Win Rate
81.08%
Trades Closed
37
Max. floating drawdown
-7.20%
Total Fees
$23.83
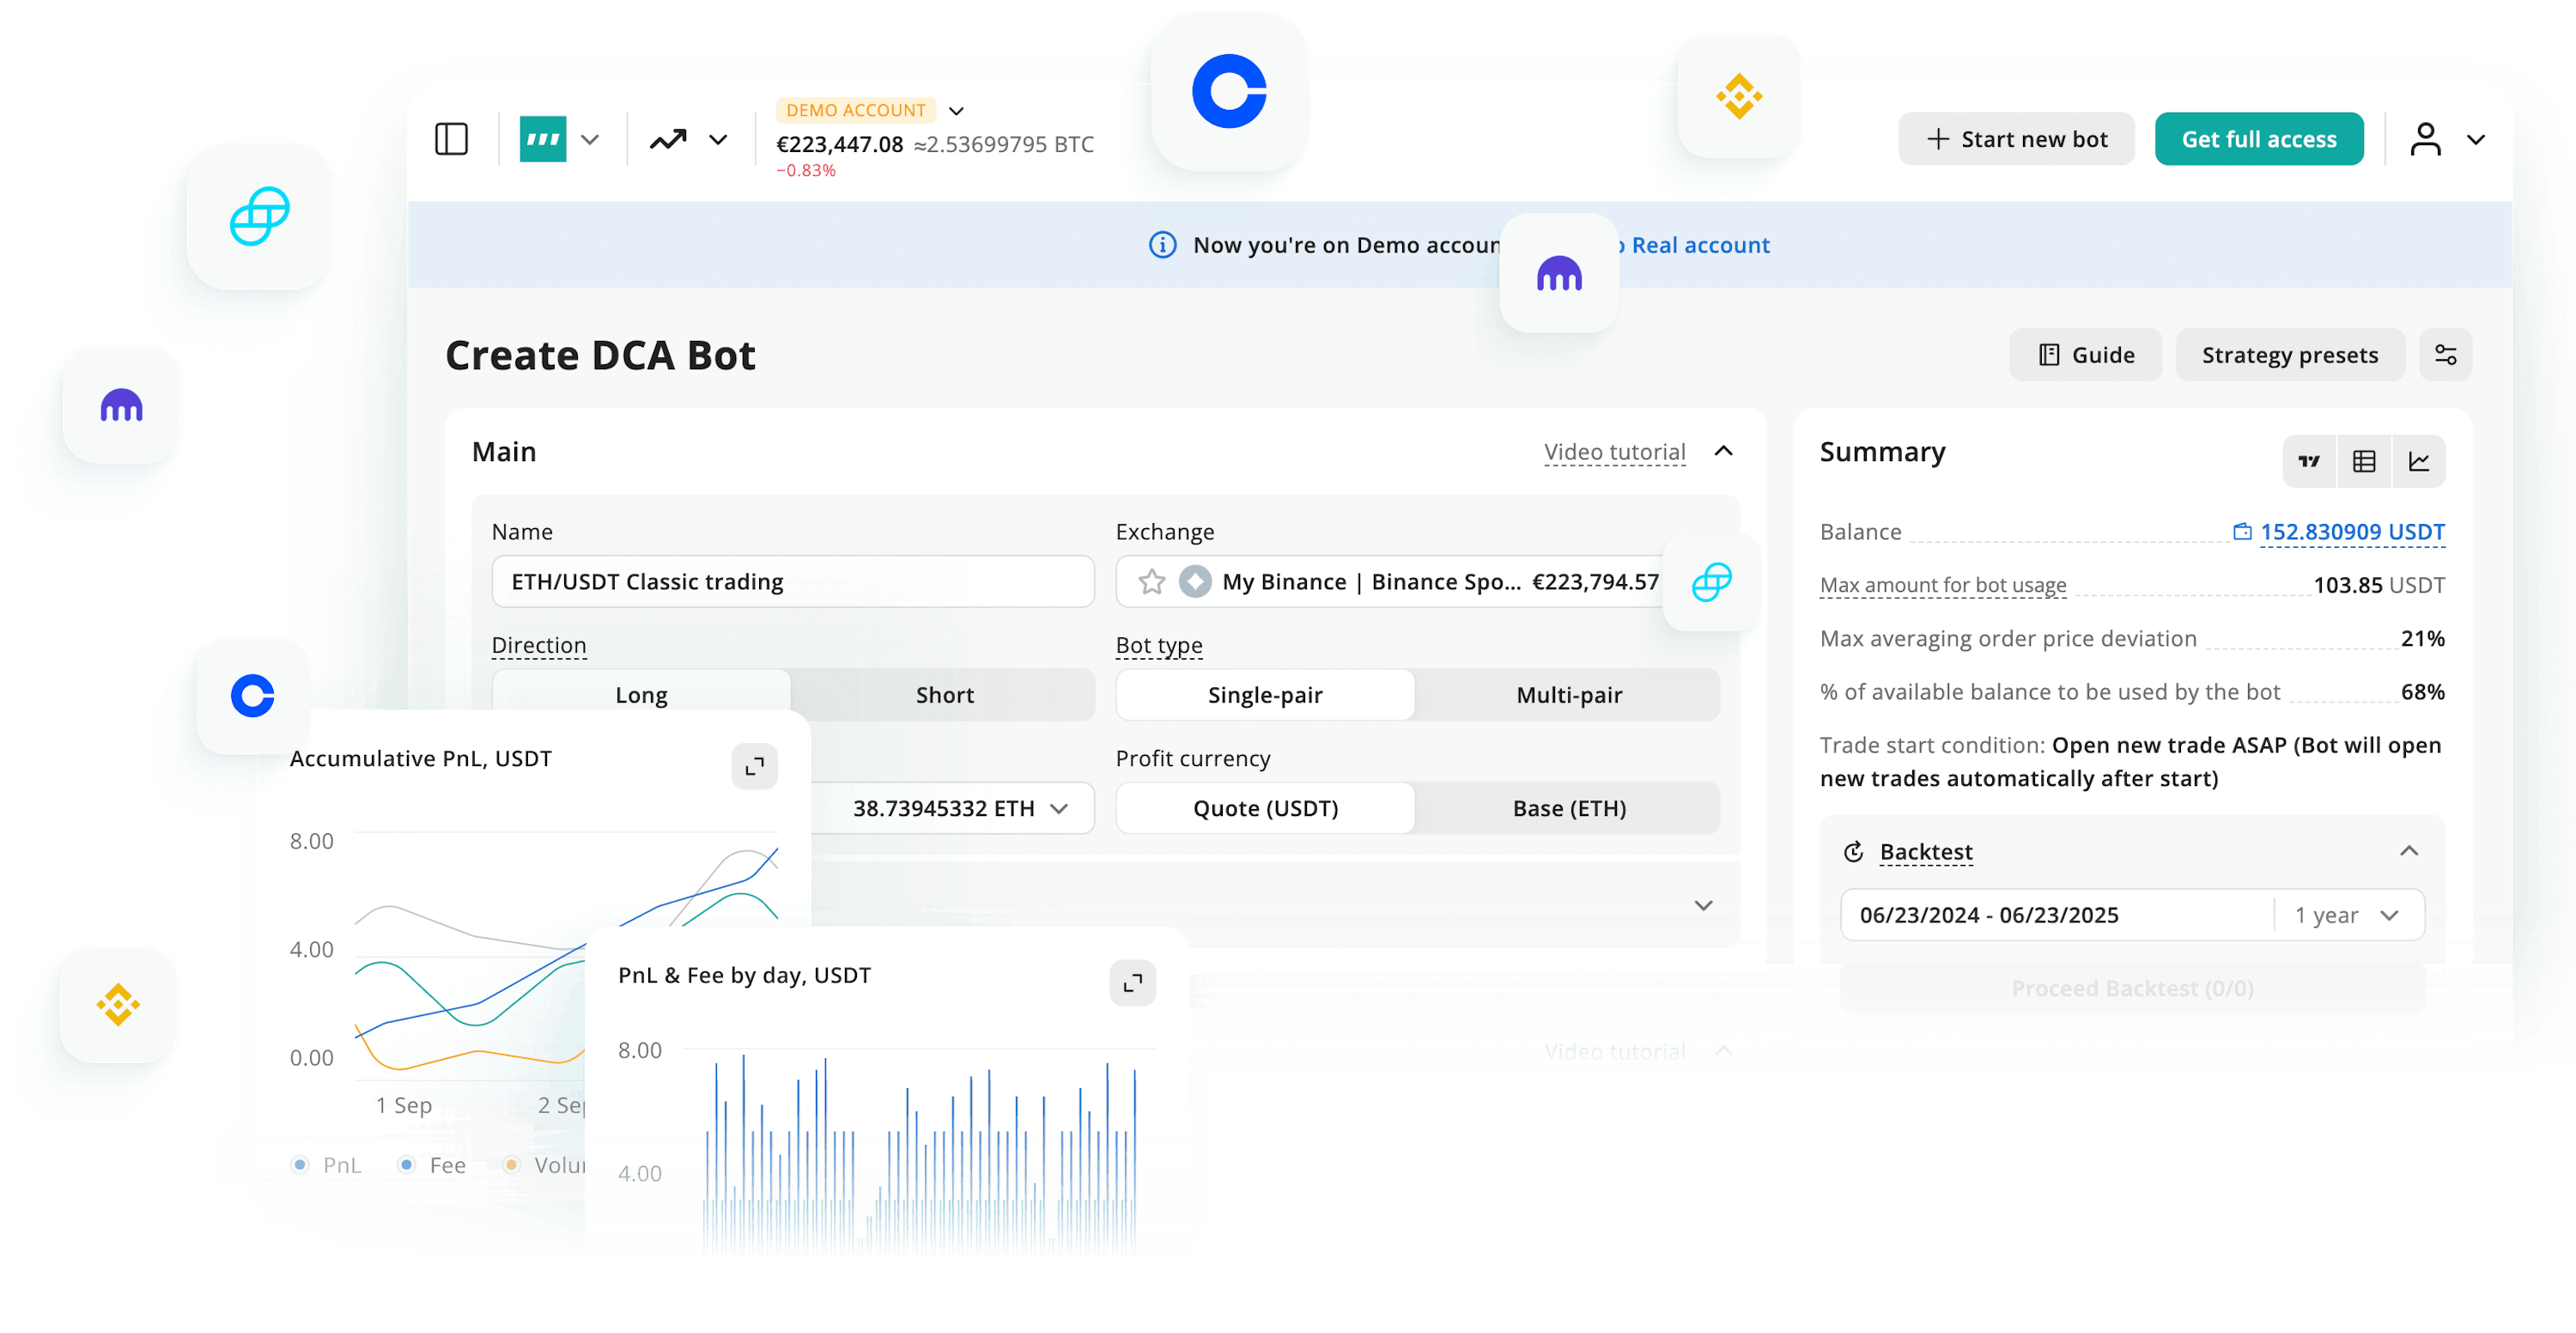
Aproveche las oportunidades que los traders manuales no pueden aprovechar
Conecte una o varias cuentas de exchange a 3Commas
Arma tu bot de trading automatizado, ponlo a prueba con datos reales del mercado y deja que opere tu cuenta con confianza
Activa tu estrategia y deja que 3Commas la ejecute con precisión, así tú puedes enfocarte en hacer crecer tu portafolio
Construya su futuro financiero con bots de trading que pueden dominar cualquier mercado
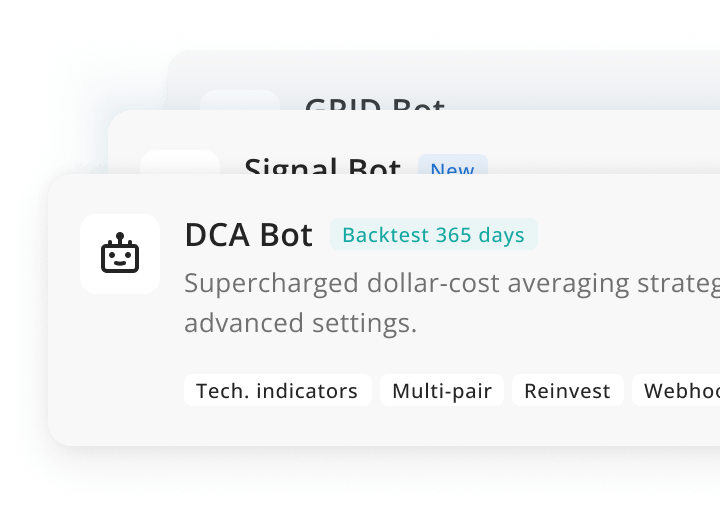
Este bot se erige como el más flexible y configurable dentro de 3Commas, ofreciendo una rica variedad de configuraciones que los usuarios pueden personalizar para alinearse con sus estrategias únicas. Los bots multipares pueden supervisar más de 100 pares para encontrar la operación óptima que cumpla sus condiciones.
Acerca del bot DCAReúna la mejor información de TradingView y conviértala en un bot. El Signal Bot permite estrategias aún más avanzadas, como operar en posiciones Largas y Cortas con el mismo bot, así como el control adicional de posiciones, posibilitado con la integración de Smart Trade.
Acerca del bot SignalA los traders profesionales les encanta la regularidad, y establecen y olvidan las capacidades de bajo mantenimiento. Este bot de IA realmente sobresale en los mercados donde la tendencia de los precios se mueve consistentemente hacia los lados. Funciona buscando hacer un gran número de pequeñas operaciones exitosas.
Acerca del bot GRIDObtenga un control granular de las posiciones para conseguir el cierre que desee. Utilice Trailing Take Profit, Trailing Stop Loss, y Multiple Take Profit para mejorar los márgenes de sus operaciones en cualquier exchange, todo ello desde una sola interfaz.
Acerca de Smart TradeOportunidades Strike fast y scalp, para operaciones únicas en cualquiera de sus exchanges conectados. Terminal es su punto de acceso único para operaciones manuales rápidas de órdenes de límite y de mercado.
Acerca de Terminal

Con nuestro Programa de Afiliados flexible, podrá transformar su influencia en una importante fuente de ingresos pasivos
Forme parte de una próspera comunidad de traders en 3Commas. Comparta sus estrategias, obtenga conocimientos de expertos y encuentre el apoyo que necesita para destacar en su trayectoria con las criptomonedas.

Fortalecemos proactivamente nuestras medidas de seguridad para hacer frente a las amenazas en evolución.
3Commas no tiene acceso a su cuenta de exchange y no puede retirar sus fondos.
Nuestro software cumple las normas más estrictas para que pueda estar tranquilo.
Conecte sus cuentas de exchange a través de la integración oficial de Fast Connect o manualmente con las claves API
Clasificado
Excelente
en
1,479 calificaciones
Hacer backtesting en 3Commas me facilita la vida. Puedo probar ideas, ver qué funciona y evitar errores tontos; todo sin perder dinero. Compré el plan Expert para hacer más pruebas.
Durante mucho tiempo usé una estrategia que creía rentable, pero a largo plazo iba perdiendo dinero poco a poco. Gracias a la función de backtesting de 3Commas me di cuenta de que solo necesitaba hacer unos pequeños ajustes para volverme un trader rentable.
Llevo un par de años con 3Commas, y sus potentes bots, una vez que entiendas su mecánica, pueden generar buenos rendimientos con un riesgo mínimo (si quieres sabes lo que estoy logrando, estoy logrando un 15-30% anual con poco riesgo y sin apalancamiento.) Puedes ganar dinero mientras duermes y seguir aprendiendo a medida que avanzas.
Durante los últimos cuatro años, he estado usando 3Commas. He probado casi todas las herramientas de bots DCA del mercado, y 3Commas es la mejor hasta ahora. El principal beneficio es que 3Commas es el único software que ofrece bots DCA compuestos de múltiples pares con señales personalizadas.
He usado otros bots de trading, pero este es mucho mejor, y soy capaz de controlar mis pérdidas y maximizar mis ganancias mucho mejor. Seguiré usándolo cada vez más.
Soy nuevo en el trading de criptomonedas y he podido usar 3Commas fácilmente. Aprendí mucho del trading en papel y me siento seguro al usar el sitio.
Deje que nuestra tecnología se encargue de las tareas tediosas mientras usted se centra en innovar nuevas estrategias
No se requiere tarjeta de crédito
Sin obligaciones
Sin cargos ocultos
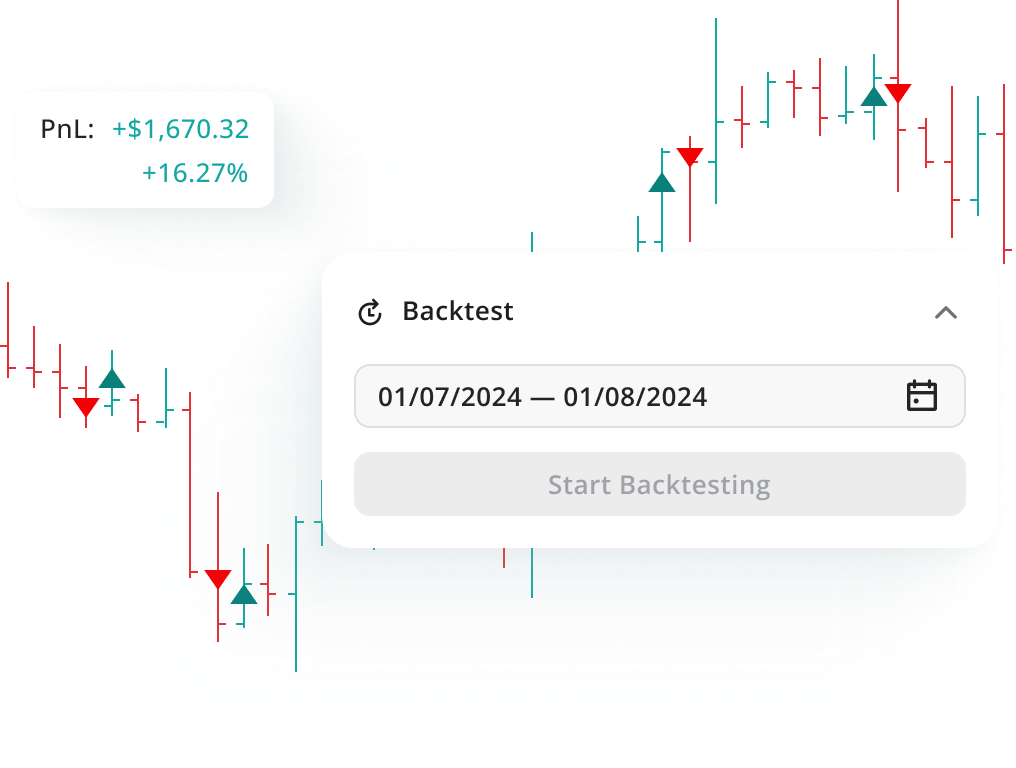
El backtesting simula operaciones con datos históricos de forma instantánea. El paper trading simula operaciones en tiempo real usando las condiciones actuales del mercado.
El backtesting es tan preciso como los datos y la lógica que usas. No puede predecir el futuro, pero te muestra cómo habría funcionado tu estrategia en condiciones pasadas, y ese es el mejor punto de partida para controlar riesgos y hacer mejoras.
Los bots automatizados ayudan a los usuarios a asignar sus recursos de manera más efectiva, implementando y afinando varias estrategias. Los usuarios deben determinar con qué estrategia de trading configurar el bot. Esto incluye desarrollar un conjunto de reglas sobre cómo el bot selecciona los prerrequisitos para ese momento y los comandos para ejecutar la operación. El bot siempre operará siguiendo la estrategia elegida, que definirá el nivel de éxito que los usuarios pueden lograr. Antes de aplicar la estrategia, recomendamos practicar usando una cuenta demo.
Los bots automatizan las acciones que un usuario normalmente realizaría manualmente. Se basan en activadores, también conocidos como señales, para decirles cuándo ejecutar las órdenes de compra y venta en función de los condicionantes que especifiquen los usuarios. Estas señales supervisan los movimientos del precio de las divisas en función de las conexiones API con el exchange de criptomonedas, y luego siguen las órdenes del usuario cuando se cumplen las condiciones de mercado. Es posible usar múltiples señales para crear estrategias de trading complejas que son muy difíciles de ejecutar manualmente. Los bots de trading más comunes son los bots DCA, los bots Grid, los bots de Futuros, los bots de Opciones, los bots de Arbitraje y los bots HODL.
Usar un bot de trading de criptomonedas es la mejor manera de operar con criptomonedas si planea hacer algo que no sea comprar y mantener. Los bots están constantemente activos, ejecutando su estrategia las 24 horas, liberándolo de la carga de introducir manualmente numerosas órdenes en su ordenador. Usar un bot de trading de Bitcoin, por ejemplo, le permite automatizar la compra en mínimos y vender en máximos cuando el mercado es dinámico. Usar bots le permite tener sus activos trabajando para usted para buscar oportunidades y aumentar el valor de su cartera en lugar de esperar sentado.
Si los traders utilizan las estrategias y configuraciones correctas, pueden lograr un crecimiento significativo de la cartera por medio del trading con bitcoin o altcoin. Mucho depende de la experiencia y estrategia de trading. Con un trading más agresivo, los ingresos son más altos, pero los riesgos son en consecuencia más altos. Con un trading más tranquilo, los ingresos son más bajos, pero los riesgos se reducen en consecuencia. Los nuevos usuarios probablemente experimentarán porcentajes de éxito más bajos hasta que aprendan más sobre cómo hacer análisis técnicos de mercado y cómo afinar sus bots para obtener un mejor rendimiento.
Ya se ha demostrado que el trading automatizado funciona en millones de bots de trading. La clave es elegir una estrategia fiable y un software de trading que cuente con bots de trading de criptomonedas con una trayectoria probada. El software también debe ser muy transparente con los datos de rendimiento para que tenga la información que necesita para crear una estrategia de trading sólida.
Hay muchas condiciones de mercado en las que mantener no es una estrategia viable. Si el mercado está bajando rápidamente, una estrategia para vender activos y luego volver a comprarlos a un precio más bajo puede proporcionar ganancias significativas para la cartera del usuario cuando el mercado se recupere. Cuando el mercado está plano, un bot Grid puede aprovechar las fluctuaciones diarias para hacer crecer potencialmente la cartera del usuario poco a poco con el tiempo, en lugar de tener sus monedas almacenadas sin hacer nada. 3Commas proporciona la tecnología que permite el uso de la estrategia de comprar y mantener, y el enfoque de trading automático. El usuario elige qué estrategia utilizar.
Para configurar un bot, un usuario necesita tomar varias decisiones clave. Primero, el usuario debe decidir el tipo de bot a utilizar. Luego, vincular una cuenta de exchange de criptomonedas a 3Comas, con un alcance limitado de permisos. Finalmente, el usuario configura las reglas de trading y selecciona la estrategia para el bot.
La mayoría de los softwares de trading con criptomonedas ofrecen una opción gratuita que incluye 1-2 bots DCA o Grid. Esta es una manera de bajo coste o sin coste de aprender el software, pero la mayoría de los operadores querrán actualizarse a un plan de pago que ofrezca más bots para poder ejecutar sus estrategias de trading de forma más efectiva. Por lo general, puede registrarse en suscripciones de pago usando una tarjeta de crédito o débito o incluso pagar con Bitcoin, Ethereum o alguna otra stablecoin o altcoin. 3Commas tiene tres tipos de planes de suscripción: plan Gratuito, plan Pro y plan Expert.
Puede que exista un problema con el método de pago, en cuyo caso es necesario contactar con nuestro equipo de soporte para obtener ayuda. 3Commas no puede ofrecer ningún tipo de servicio de pago, incluidos los planes de suscripción a 3Commas, a los usuarios que sean residentes de países que actualmente estén en la lista de sanciones de la Unión Europea, la República de Estonia u otras naciones y organizaciones internacionales enumeradas en el Artículo 26 de nuestras Condiciones de uso (Client Terms of Use)
Nuestro Grid Bot de IA aumenta la seguridad de los activos de los clientes y trata de eliminar el riesgo potencial de liquidación. Combinando la IA con una estrategia probada de grid trading, creamos 3Commas AI Grid Bot que opera de forma autónoma, comprando bajo y vendiendo alto, al tiempo que modifica constantemente las posiciones para maximizar potencialmente los rendimientos y minimizar el riesgo.
Para los bots de 3Commas, las condiciones del mercado no son un factor limitante: pueden operar tanto en mercados alcistas como bajistas. Los bots como el DCA y el Grid se ajustan en función de la configuración y la estrategia del usuario. El Signal Bot se puede integrar con TradingView, donde las estrategias o indicadores definidos por el usuario ya están configurados.


