NEM (XEM) Live Price

Market capitalization of a coin is calculated by multiplying the current price in USD or EUR of a single unit of coin by the current circulating supply of that coin available for sale or purchase on public exchanges.
Ex: If the price of BTC is currently $20,000 and there are 50,000 BTC available on public exchanges, then the Market Cap of BTC is $1,000,000,000.
Volume of a coin is the total spot trading volume reported by all exchanges over the past 24 hours multiplied by the value of an individual unit of that coin.
Circulating supply is the approximate number of units of a coin that are currently circulating in the market in the hands of the general public.
Release date is when the first tokens of this cryptocurrency were created and made available for mining or whatever other creation mechanism was specified in this token’s blockchain protocol.
Data provided by Coingecko API
Start Trading on 3Commas Today
or fast Sign Up with:

XEM price Statistics
NEM Price Today
Price Change
The percent change in price for this asset compared to 24 hours ago
Trading Volume
Popularity is based on the relative market cap of assets.
NEM Supply
Circulating supply shows the number of coins or tokens that have been issued so far.
NEM Market Cap
Market cap is calculated by multiplying the asset's circulating supply with its current price.
Fully Diluted
Market Cap
NEM Price Yesterday
NEM Price History
The highest price paid for this asset since it was launched or listed.
Data provided by Coingecko API
XEM to USD converter


Data provided by Coingecko API
Real-Time NEM Price Chart (XEM to USD)
NEM Exchanges
Exchange | Price | Pair | Spread | 24 Volume | Last Traded |
|---|---|---|---|---|---|
Binance | $0.02 | XEM/USDT | $0 | $299,857 | Recently |
Gate.io | $0.0003219 | XEM/USDT | $0.0000001 | $3,633 | Recently |
NEM Historical Price Data (USD)
Date | ||||
|---|---|---|---|---|
10/26/2026 | $0.00031 | $0.000313 | $0.000339 | $0.0003 |
10/25/2026 | $0.00031 | $0.00031 | $0.00031 | $0.0003 |
10/24/2026 | $0.000339 | $0.00031 | $0.000339 | $0.000291 |
10/23/2026 | $0.00033 | $0.000339 | $0.000339 | $0.000311 |
10/22/2026 | $0.000359 | $0.00033 | $0.000387 | $0.00032 |
10/21/2026 | $0.000367 | $0.000359 | $0.00037 | $0.000339 |
10/20/2026 | $0.000314 | $0.000367 | $0.000358 | $0.000314 |
Data provided by Coingecko API
XEM Price Live Data
The live price of XEM is $ 0.000311 per (XEM/USD) today with a current market cap of 2.8M USD. 24-hour trading volume is $ 33,841 USD. XEM to USD price is updated in real-time. NEM is -8.45% in the last 24 hours. It has a circulating supply of $ 9,000,000,000 XEM.
NEM Coin Price Chart determines the exchange rates between major fiat currencies and cryptocurrencies – including BTC, ETH and XRP to USD, EUR, GBP. Conversion rates are based on Live XEM Price Index and the price indices of other digital assets.
This content and any information contained therein is being provided to you for informational purposes only, does not constitute a recommendation by Coinbase to buy, sell, or hold any security, financial product, or instrument referenced in the content, and does not constitute investment advice, financial advice, trading advice, or any other sort of advice.
NEM (XEM)
NEM (XEM) is a cryptocurrency and blockchain platform for the creation of Smart Assets that was launched in 2015. The platform is designed to allow for the creation and management of assets based on client-developed digital signatures, or 'Smart Assets'. The underlying blockchain was also designed with speed, performance and security in mind, particularly in terms of long run scalability. It also uses a novel Proof of Importance (PoI) system that rewards users for employing the XEM coin in transactions. The value of NEM (XEM) saw a small rise before the 2017 crypto price boom after a flat first two years. It followed the general boom and bust of the overall crypto market, and has since settled at a relatively low per unit price compared to similar digital currencies. The overall market cap of NEM (XEM) is now in the top 30.The NEM platform is focused on providing users with a user-friendly system for defining and exchanging assets. Unlike many other cryptocurrency platforms, the defined assets are given a digital signature, making them a so-called 'Smart Asset', that can be tracked on the blockchain itself, thereby allowing for much more advanced and complex transactions using the blockchain.The Proof of Importance (PoI) system used by NEM is also revolutionary in the world of cryptocurrency coins, as it rewards users for actually employing the system to make transactions, as opposed to just mining and/or hoarding the XEM as a digital currency
Crypto fear & Greed Index
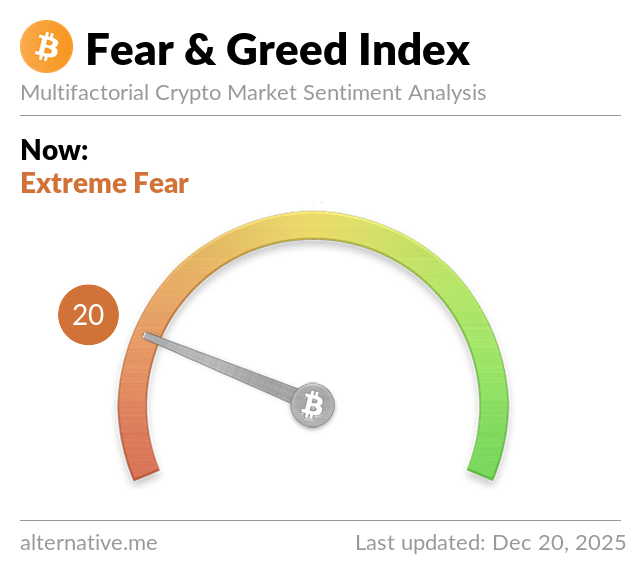
Historical Values
Next Update
The next update will happen in:
9 hours, 45 minutes and 17 seconds
Explore Our Other Products for XEM
DCA Bot
Invest in XEM gradually and reduce risk using our supercharged Dollar-Cost Averaging Bot. Automate your entries at better prices, set take profit targets, and protect your capital with trailing stop loss. No coding required.
Signal Bot
Execute your XEM trading strategy using webhook signals from any source or using a TradingView Strategy.
GRID Bot
Capitalize on XEM price movements 24/7, even in sideways markets. The Grid Bot places smart buy and sell orders within preset ranges to capture every market swing.
FAQ
Actual price of NEM to USD now is $ 0.000311
NEM ticker is XEM
You can buy NEM on any exchange or via p2p transfer. And the best way to trade NEM is through a 3commas bot.
You should not expect to get rich with NEM or any other new technology. It is always important to be on your guard when something sounds too good to be true or goes against basic economic principles.
NEM (XEM) hit another all-time high over $ 1.87 in 06.01.2018.
NEM Market Cap is at a current level of 2.8M, down from 3.03M yesterday. This is a change of -8.45% from yesterday.
Latest 24-hour trading of NEM (XEM) is $ 33,841.
The current circulating supply of NEM is $ 9,000,000,000 with the maximum amount of $ 0.
NEM current Market rank is #2031. Popularity is currently based on relative market cap.
Gainers & Losers








Data provided by Coingecko API
Popular Cryptocurrencies


Data provided by Coingecko API
More Cryptocurrencies


Data provided by Coingecko API

