

What Is Crypto Trading? All You Need to Know in Plain English
JUL 26, 2021
14 MIN
Become a crypto master
Learn everything about crypto,
trading and bots

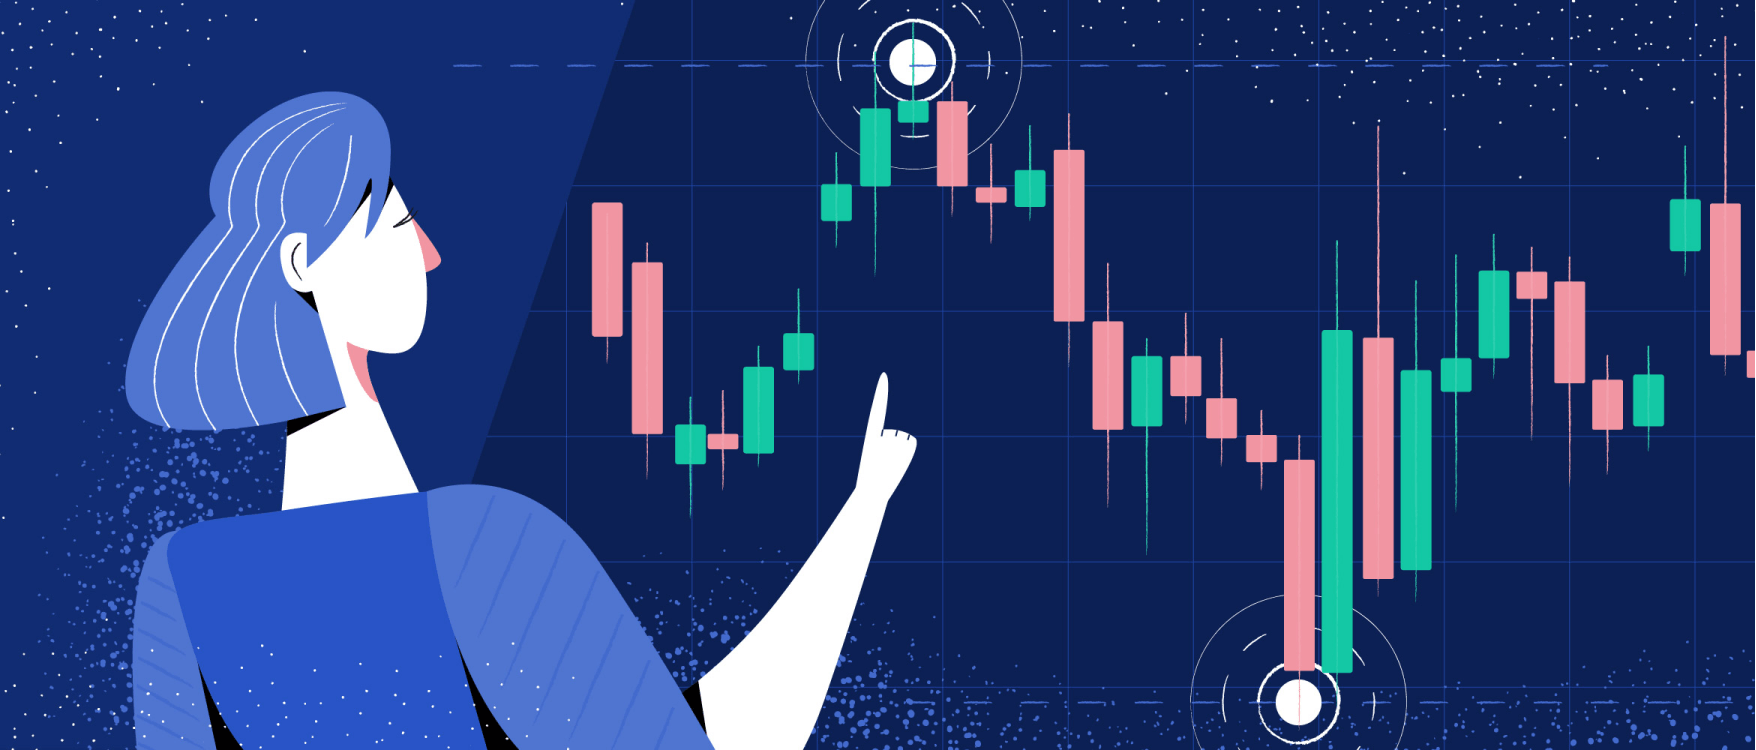
A casual observer of the stock market is often bombarded with the term “volatility.” This can include things like: “This asset class is highly volatile.” “The market volatility is low, so it’s time to start trading.” “Learn how to trade with volatile options.”
Volatility seems to be everywhere, yet its meaning is somehow enigmatic. In this article, we will explain what volatility is and how to calculate it.
Start Trading on 3Commas Today
Get full access to all 3Commas trading tools with free trial period

First, consider two pictures. First is the share price change of the Microsoft Corporation (MSFT) for the week ending June 11, 2021, according to Yahoo.Finance.
The chart depicts a relatively steady rise in the price of MSFT. Over a week, it gradually gained roughly $10 per share, climbing up from about $250 to about $260.
And here’s Bitcoin. This chart also shows how its price changed over the same period, and is also from Yahoo.Finance.
Compared to Microsoft Corporation, this chart looks much more erratic. In one week, the price of Bitcoin goes from $39,000 to below $33,000, representing a more than 15% change in price. But even further, within the time frame there are a variety of local peaks and troughs which see the price of Bitcoin swing higher and lower in a quick manner.
Clearly, the two charts look quite different—more specifically, the two assets are quite different in terms of their volatility. Bitcoin’s price changes more often and more drastically than Microsoft Corporation’s share price over the same period of time. This means, Bitcoin is more volatile than the stock of Microsoft.
Volatility is a measure of how much an asset’s price can change over a given period of time. As such, volatility measures the riskiness of an investment and allows for sorting assets on this basis. All else being equal, the higher the volatility, the greater the risk of the asset.
What does high volatility mean, then? If an asset’s volatility is high, the asset’s value can change dramatically in either direction, up or down. Conversely, the lower the volatility, the steadier the price of that asset.
A market is considered volatile if prices change quickly and widely, usually above a certain specified threshold percentage. For example, if the stock market rises and falls more than 1% during a long enough time interval, it can be considered volatile. Highly volatile markets can be good for traders that have a high risk tolerance and are willing to trade these price swings.
Volatility can be calculated on the basis of models (projected or implied volatility), or based on historical statistics (realized or historical volatility). It’s a very important metric in the stock market, especially for the purposes of options trading.
Next, we will look at the different ways to calculate volatility along with the factors that affect it.
To better understand the different ways of calculating volatility, we will use a hypothetical example of an asset for all of our examples. We will use 0.04 Ether as our asset. Like many other cryptocurrencies, Ethereum is highly volatile, especially over short time periods. But, for simplicity's sake, let’s assume that during a year, Ethereum’s price rose steadily by small increments each month so that our 0.04 Ether was worth $110 in January, $111 in February, and then kept gaining just $1 a month until December. While we understand this example is unrealistic, it will make the calculations easier to understand.
Now that we know the price of Ether gained $1 from month to month, is there a way to summarize this overall price change in just a single figure? Instead of comparing the monthly values one by one, statisticians compare each of them to the mean—or average— using a summary statistic called variance. Variance captures just how diverse different values are in a distribution.
Volatility is a special case of variance, calculated for a specified time interval. In other words, it captures the diversity of values for a specified subset of the entire distribution. For practical purposes, it is more convenient to use standard deviation, which is the square root of variance.
Now, let’s get our hands a little dirty and see how this works in practice. We can calculate the annual volatility of our imaginary Ether through the following steps:
Remember that volatility is basically a standard deviation for a temporally bounded distribution of values. In this case, we have the values for a 12-month period. To calculate the standard deviation, we need to calculate the variance, and to do that, we need to know the mean. To calculate the mean, simply add up the monthly values and then divide the sum by the number of months:
($110 + $111 + $112 + $113 + $114 + $115 + $116 + $117 + $118 + $119 + $120 + $121) / 12 = $115.50
The next step is to figure out just how much each month’s price diverges from the mean. To do that, subtract each of the monthly values from the mean, as shown in the image below in column D:
Now we need to summarize these differences. However, we can’t simply add up the deviations, because their sum will be equal to zero. To avoid that, each value must be converted into a positive number. The conventional way to do that is to square each of the monthly values, as shown in column E.
Finally, let’s calculate the variance. To do that, simply add up the squares of each month’s deviations and divide the resulting sum by the number of months. When we do this, the resulting annual variance is $11.92. To get the standard deviation, just take the square root of the variance, which, in our example, comes to $3.45.
This figure shows the level of risk associated with trading. A volatility of $3.45 is how much the monthly closing price deviates from the average. That is, on average, the monthly closing prices are between $112.05 and $118.95.
Our hypothetical distribution of monthly closing prices doesn’t differ significantly from the normal distribution, although it isn’t normal. If, however, the monthly closing prices were normally distributed, it would be possible to know where most of the values would lie relative to the average of the distribution. In this case, roughly 68% of all values would fall within one standard deviation from the mean, 95% within two standard deviations, and 99.7% within three standard deviations. (You can prove that yourself by automatically generating a normal distribution and calculating its mean and standard deviation).
For the purposes of measuring volatility, price changes are usually expressed in percentages. Let’s consider our imaginary distribution of the monthly closing prices on our tiny bit of Ether. To quantify a price change, simply subtract the price at time 1 from the price at time 2, and divide the result by the price at time 1, as shown in the formula below:
For example, the price change between January and February would be:
($111 - $110) / $110 = 0.009 (or roughly 0.9%)
Because of the nature of our hypothetical distribution, the prices change only slightly upwards, and the amount of change decreases as the monthly closing price increases. Nevertheless, it can still be used for the purposes of illustration.
We can calculate the inter-monthly price change for each of the 12 months and express it as a percentage, as shown in column C in the picture above. To determine the volatility of this asset, we need to calculate the standard deviation of the monthly price changes in exactly the same way as we did above.
The standard deviation is 0.026%, indicating a rather low average monthly price volatility. In trading, it’s often useful to rely on the annualized volatility. To calculate this, simply divide the average monthly price volatility by the square root of the number of observations within the annual period, in our case, 12. Thus, the annualized volatility is 0.018%.
Why do prices fluctuate anyway? An asset’s price is a function of its supply and demand on the market. Thus, the causes of price volatility should be sought in the causes of changing supply and demand: extreme changes to supply and/or demand will result in a highly volatile asset. Typically, analysts distinguish among the following reasons:
Many industries move through specific lifecycles, some of which have to do with the changing seasons. For example, agriculture supply changes with seasonality, as certain fruits and vegetables become available only during harvest time.
On the other hand, seasonality may also influence the patterns of demand. For example, in the hotel industry there is a distinction between “high” and “low” seasons with correspondingly high and low levels of demand. Just think about how hard it can be to book a room on Christmas Eve. This is also common in the airline industry as well.
With climate change looming large, the frequency of extreme weather events is increasing while weather is becoming less predictable as a whole. Events like hurricanes, typhoons, storms, droughts, wildfires, etc. can influence patterns of supply and demand in various markets.
Agriculture is again a case in point, because harvests depend on weather patterns. Poor weather conditions can result in a decreased supply of crops, resulting in highly volatile prices for those commodities. Weather cycles can also influence transportation links, thus affecting the price of gasoline and other commodities.
In the stock market, traders are the key agents who make deals, and it is they who enact the forces of supply and demand. Yet traders are human beings, not cold-blooded robots, and therefore have emotions and can engage in herding behavior.
The more worried traders are, the higher the volatility of the assets they are buying. The list of factors influencing traders’ emotions is potentially endless and can include reasonable expectations for some events to occur, e. g., the completion of international trade deals or infrastructure projects, as well as irrational fears and gut feelings.
The presence of emotions in trading explains the recent rise of algorithmic trading, in which emotionless trading bots replace humans. However, algorithms are still developed by humans who do have emotions and, more importantly, assumptions about how to trade. Even as algorithmic trading can sometimes help to reduce volatility, it is still not immune from market failures like a Flash Crash.
General volatility factors such as seasonality, weather, emotions, etc. apply to most assets, even though they may affect certain assets more than others. However, there are also asset-specific volatility factors associated with the peculiarities of different asset classes.
Consider cryptocurrencies: this financial instrument is still in its infancy and not as heavily regulated as some other asset classes, which causes it to be relatively more volatile. When investors trust an asset class the volatility is generally low. Unfortunately for cryptocurrencies, their newness and uncertainty make them hard for investors to fully trust.
As an example, U.S. Treasury bonds are considered one of the safest assets in the world because their value is backed by the U.S. government’s ability to repay its debts, and the public’s trust in that ability. On the other hand, Bitcoin does not have such state backing—indeed, part of its appeal is its independence and the permanently fixed monetary supply. However, this makes Bitcoin—and other crypto-assets more generally—vulnerable to such things as public opinion, especially when expressed by celebrities and other influencers. This can be seen in the recent slump of Bitcoin that was said to be caused by Elon Musk’s tweets.
Stock market professionals distinguish between several kinds of volatility depending on how it is calculated.
Stock volatility is typically measured through a specific parameter called beta (β). A stock’s beta measures how strongly the price is correlated with some benchmark, usually the Standard & Poor’s 500 Index. If a stock price follows the index smoothly, the beta will be close to 1. Stocks with betas greater than 1 are more volatile than the benchmark.
Conversely, stocks with betas lower than 1 are less volatile than the benchmark. For example, if a stock has a beta value of 1.5, that means that it has historically changed by 150% for every 100% change in the benchmark. If a stock has a beta value of 0.5, that means that it has historically moved 50% for every 100% move in the index, and thus is less volatile than the benchmark.
Volatility can also be calculated on the basis of historical statistics taken for a specified time interval (e.g., 12 months). If the stock price has changed widely and quickly during the past year, it is more volatile and therefore riskier.
Thus, assets can be compared on the basis of their respective historical volatilities. Even though sometimes historical volatility is calculated for short time intervals such as a few days, it is an imperfect measure because of its backward-looking character. Analysis of historical volatility is based on a linear extrapolation of the past into the future, which is not always warranted.
Implied volatility is more often used because it is forward-looking. As the name suggests, it captures traders’ expectations about the future volatility. Implied volatility is most often used to price options contracts. In other words, it represents how much volatility the stock will have in the future, according to the expectations of the options traders. If options prices rise, the implied volatility of the underlying asset is increasing, and vice versa, all else being equal. Thus, traders tend to buy options if they expect that the volatility will rise, moving the option prices higher, to then sell as the volatility and the price begin to decrease.
Market volatility refers to the velocity of price changes in a given market. Volatility tends to increase in certain phases of the market cycle, e. g. when the market approaches a peak or a trough. There are specialized indexes to measure market volatility. For example, the VIX or Volatility Index, developed by the Chicago Board Options Exchange, tracks the 30-day expected volatility of the S&P 500 options. The higher the VIX, the riskier the market.
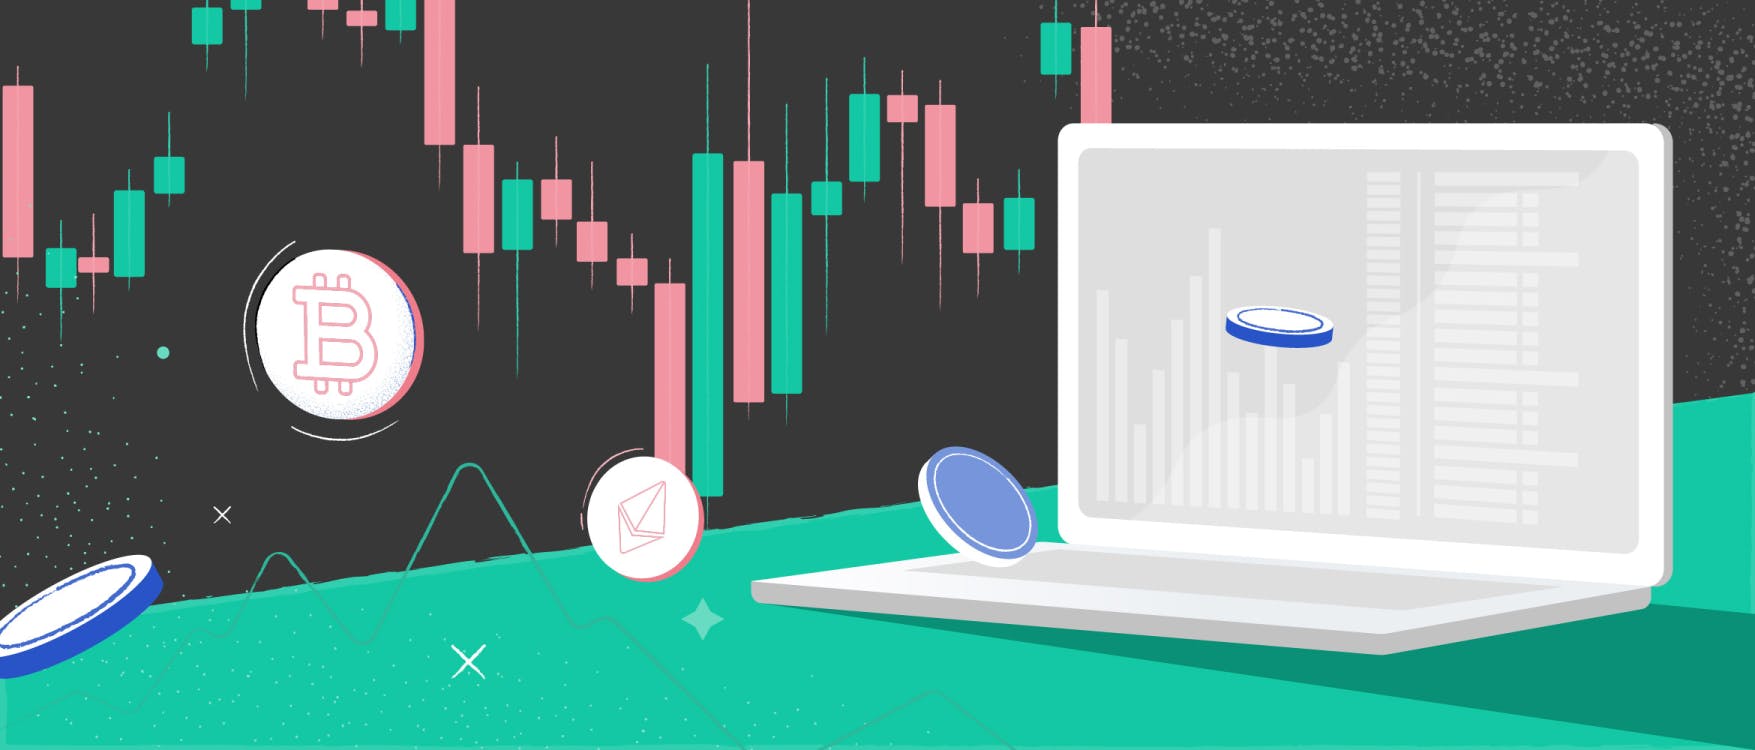
Understanding volatility helps when building trading strategies. Firstly, it’s important to understand the volatility profile of the asset class in which one wants to invest. For example, cryptocurrencies are considered more volatile than cash, gold, or bonds. They are even considered more volatile than assets like stocks, derivatives, and forex, all of which are on the more volatile side of the spectrum.
Secondly, there is a variation of volatility within cryptos as an asset class. There are aggregate volatility indices like Binance that track the volatility of individual cryptocurrencies, and also specialized services like Yahoo.Finance, in which one can monitor price changes of different cryptos. For example, this is what a watchlist of the most volatile cryptocurrencies looked like on June 15 2021:
As seen in the screenshot, there is a wide variation in the price changes of different cryptocurrencies, which must be taken into account when trading. Also keep in mind, stablecoins — cryptocurrencies pegged to the price of real-world assets — tend to be significantly less volatile than other cryptocurrencies, and can skew the overall volatility of the crypto market. All else being equal, cryptocurrencies like Bitcoin Cash, Litecoin, and Ripple will tend to be more volatile than Tether, Dai, USDC, and other stablecoins of various kinds.
Third, high volatility makes it possible to earn large gains relatively quickly, although this requires considerable risk tolerance. While low volatility is good for those who are risk-averse, high volatility works well for traders willing to take on considerable risk. Here are a few common-sense tips for trading in the volatile crypto market:
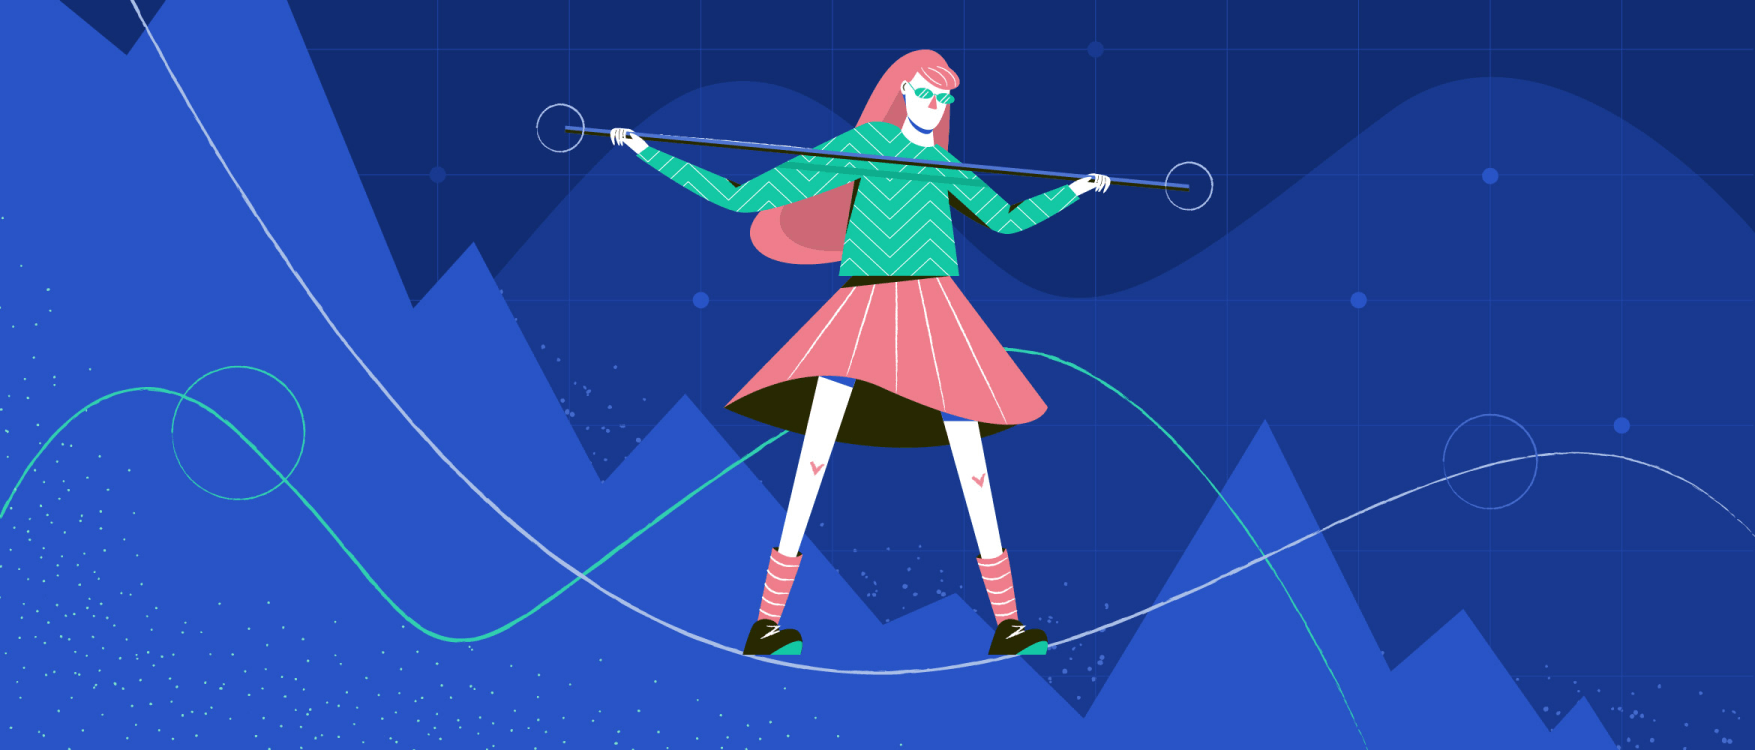
The fact that cryptocurrencies are highly volatile doesn’t mean it’s impossible to trade profitably and manage risk at the same time. For example, some high-volatility strategies rely on trading bots that can react to relevant price changes faster than humans, which is the key to high-volatility trading. Assume there is an asset that is stochastically volatile: that is, the volatility of its price is not constant, but changes at random. In other words, at any given time it’s slightly more or less volatile, and these volatility levels fluctuate randomly, as shown in the picture below:
For trading purposes, it is very important to be able to react to volatility changes, as represented by the peaks and troughs on the picture. However, these changes happen very quickly, sometimes even beyond the speed of human perception. To react to them properly, traders use algorithms, or trading bots.
The idea of a high-volatility strategy is to use trading bots to quickly issue orders depending on the changes in the level of volatility. Once the bot sees a peak, it begins to trade until the fulfilment of some specified trigger condition, e.g., when the trend changes and assumes an opposite direction, or when there is a downward movement that significantly exceeds daily volatility. Such events trigger the bot to stop until the next peak in volatility. In other words, there are trading algorithms specifically developed for trading in highly volatile assets like cryptos. Using them makes it much easier to hone in on a trading strategy even in such highly volatile markets like cryptocurrencies.
Volatility is a measure of the riskiness of assets or asset classes, and it can be associated with a range of factors. It shows how far an asset’s values can deviate from its mean value for a given period of time. As such, it’s an important metric that must be factored into your investment strategy.
Volatility is a measure of how quickly and dramatically the price of an asset or asset class changes. It shows how far an asset’s price deviates from its mean price over a given period of time.
Volatility is calculated as the standard deviation for a distribution of prices over a specified period of time. It can be calculated on the basis of historical statistics (historical volatility), or using predictive models (implied volatility).
Typically, volatility can be caused by seasonal changes that affect the business models of certain industries. Other factors include traders’ emotions and asset-specific factors like a lack of regulations or investors’ distrust towards certain kinds of assets.
It’s important to follow the news, monitor relevant trading indicators, be disciplined and manage your risk, for example, by making stop-loss orders. A great way to maximize profits and mitigate risk is to use trading bots adapted for trading in the highly volatile crypto market.

A proven leader, successful at establishing operational excellence and building high-performance teams with a sharp focus on value creation and customer success.