- All
- Tools
- Analytics
- Technical Analysis
- Trading
- Blockchain
- DeFi
- Guides
- Company News
- Educational
- Opinion
- Price Predictions
- Market News
- News
- Trading cases
- Practical guides
- Exchanges
- Trading signals
- Cryptocurrency
- Crypto bots
- Other
Become a crypto master
Learn everything about crypto,
trading and bots

Trend Reversal Patterns
Start Trading on 3Commas Today
Get full access to all 3Commas trading tools with free trial period

Inverse Head and Shoulders, Double Bottom, Descending Wedge
The cryptocurrency market is subject to the same laws and patterns as any other market. Trends are constantly interchanging, regardless of the timeframe and the selected chart. In order to make trading decisions and find the best entry points, it is necessary to understand what signals indicate a trend reversal. The most common trend reversal patterns are inverted head and shoulders, double bottom and descending wedge.
In today’s article, we will analyze each of these patterns, consider their key features and share some ideas on how to benefit from using them.
Inverse head and shoulders
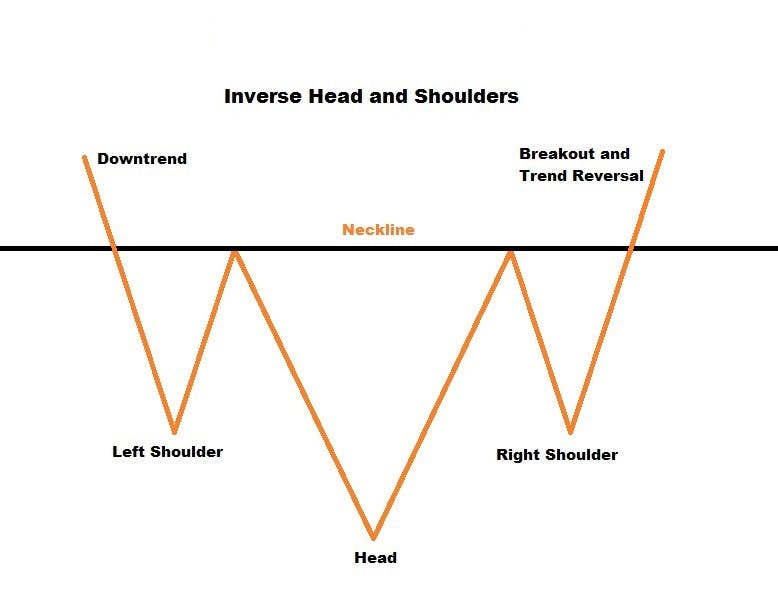
The inverse head and shoulders figure is a strong trend reversal signal. This figure is formed during a clear downtrend and consists of three parts: the left shoulder, the head and the right shoulder. Another important parameter of the figure is a so-called neckline.
The formation
The head is the lowest part of the figure, and the shoulders, located on both sides, are supposed to look similar to a certain extent. The pattern gets enforced with a decrease in volumes during the formation of the head and then the right shoulder. Although decreasing volumes are not essential for the formation of a pattern, they are worth keeping an eye on during the analysis.
The neckline is a level of resistance, which is formed from the previous two highs. The neckline is formed only after all other parts of the pattern appear. The more horizontal the neckline is, the higher the chances of the reversal are.
Opening a trade
The choice of entry point depends on one’s trading strategy. Here are the two most common options:
- Entering a position during the formation of the “right” shoulder, after breaking through the neckline, with a BUY limit order placed right above. The disadvantage of this approach is the possibility of a false breakout. To prevent possible losses, it is necessary to set a tight Stop Loss just below the neckline.
2. Entering the position after the retest, confirming the breakout above the neckline.
Placing a Stop Loss
Placing a Stop Loss is essential when entering a position. This is the way to control your losses in case the pattern fails.
- A Stop Loss can be set just below the neckline to reduce possible losses.
- A Stop Loss can be set at or just above the lowest point of the right shoulder.
Key Features
You can (a) open positions and set a Stop Loss depending on your trading style and strategy, (b) exit a position according to your preferred risk/reward ratio, (c) fix the profit when approaching the nearest support level, or follow other strategies of your choice.
When assessing this pattern on the chart, always take the time frame into account. The longer the time frame, the higher the probability of the pattern occuring.
Double bottom
The double bottom pattern is a downtrend reversal pattern; hence its formation indicates the beginning of a bullish trend. The W-shape is easy to analyze and is often seen on the popular cryptocurrencies’ charts. This formation is opposite to the double top figure and possesses a number of unique characteristics.
The formation
The double bottom pattern appears when an asset drops to certain levels and rebounds to hit another low at similar levels while forming a W-shaped figure. The corresponding lows act as a support level. Similar to the previous pattern we described, the double bottom formation also has a neckline that forms a resistance level.
When trading and analyzing the market, a rebound from the first low can be perceived as a correction of a downward movement. It is important to watch the pattern unfold as the asset bounces back down from the resistance level (neckline) and looks to find the second low, marking the support line.
A pattern is confirmed when the price breaks through the neckline. It is this breakout that acts as the signal to open a position.
Opening a position and setting a Stop Loss
As mentioned above, a breakout above the neckline is a signal to open a trade, but if you prefer a more steady and low-risk approach, it is advisable to wait for the retest of the resistance line. When opening a trade at breakout it is important to set a tight Stop Loss, just below the resistance line. This technique is preferable in terms of risk management.
Key features
The double bottom figure is only formed during the downward market movements. A smaller time frame figure during intensive market movements should not be treated as a reliable trend reversal signal. It is also worth paying attention to the distance between the pattern’s lows; the further apart they are, the stronger the pattern is.
The lows may not always be perfectly leveled, yet you can always utilize a number of technical indicators as additional market reversal signals. For instance, you may use the MA-20 moving average. If the price is below the indicator, it is highly probable that the pattern will not work.
Descending wedge
The descending wedge pattern indicates that a bullish impulse is imminent and that the trend is reversing to head in an upward direction. This pattern is both a reversal pattern and a trend continuation pattern. When such a formation takes place, it is important to determine the corresponding market conditions.
The formation
A descending wedge is formed as a result of price fluctuations between two narrowing descending channels. When the descending wedge occurs in a bearish market, it signals the soonest market reversal. If the market is in a bullish trend, the figure indicates the general trend continuation.
After determining the trend, it is necessary to build a tapering channel with lower highs and lower lows. The price should gradually get squeezed in the channel, after which a sharp impulse and a breakout should follow. The breakout is characterized by the increase of the trading volume, which can be a signal confirming the figure’s formation.
Opening a position and setting a Stop Loss
When the pattern can be determined as a reversal, one can open a trade at a breakout from the channel. To avoid losses in case of a false breakdown, it is necessary to set a short Stop Loss below the channel’s resistance level.
One can also open a trade during a retest of the resistance level. In this case, a Stop Loss can be set below the support level.
Key features
In addition to entering the market during a retest, more experienced traders engage while the asset is inside the channel. The wedge is a frequently encountered pattern in the cryptocurrency market and has an optimal risk-reward ratio when used in trading.
In order to consider the formation of the wedge, one must observe at least three highs and three lows to build the base for the narrowing channel. It is also worth noting that the breakout from the channel is confirmed if the price has consolidated above the resistance level.
Conclusion
Identifying trend reversal patterns is one of the basic skills, vital for successful trading. The use of such figures in tandem with other analysis tools will allow users to predict future market behavior more accurately, help make better trades and ensure higher profits.

A proven leader, successful at establishing operational excellence and building high-performance teams with a sharp focus on value creation and customer success.


