- All
- Tools
- Analytics
- Technical Analysis
- Trading
- Blockchain
- DeFi
- Guides
- Company News
- Educational
- Opinion
- Price Predictions
- Market News
- News
- Trading cases
- Practical guides
- Exchanges
- Trading signals
- Cryptocurrency
- Crypto bots
- Other
Become a crypto master
Learn everything about crypto,
trading and bots

When is the best time to buy Bitcoin?
Start Trading on 3Commas Today
Get full access to all 3Commas trading tools with free trial period

Should I buy Bitcoin today?
There is no straightforward answer. So, when should you buy crypto to make money? Some rules always work, and a few ideas work in most cases. First off, you should look not only at the rate but also at the trend.
When buying Bitcoin, it's vital to understand the current market situation. The most common mistake newbies make to buy on a wave of hype. So-called "hawks" create a lot of excitement and push the price up. If Bitcoin were a Ponzi scheme, its price would only go up. But Bitcoin is not a scheme, so when "dumb money" enters, it goes up, accompanied by a fast nosedive after.
This is what happened, for example, in 2017. Bitcoin grew 20 times that year, and most of that growth came in the last two months: November and December. What happened next? Falling from $19,000 to $3,500 within the next few months.
In 2021, Bitcoin broke through to almost $70,000 level. Everyone expected a further rally to 100k or higher. What happened? A sharp drop and a pullback to $30,000. Was it the best time to trade Bitcoin? Some traders prefer volatile markets; others don’t take any action until the price starts growing/dropping evenly (trend).
What’s happening now?
Bitcoin recently renewed its all-time high (ATH) at $69,000. This was followed by a first tentative and then sharp collapse to $42,000. These drops are most often caused by an influx of investment that overheats the market. It was especially felt in 2017 and also in the spring of 2021. People who knew nothing about crypto rushed buying to make super-profits. These opportunities were shouted about by the media, fueling interest. Most of them lost money.
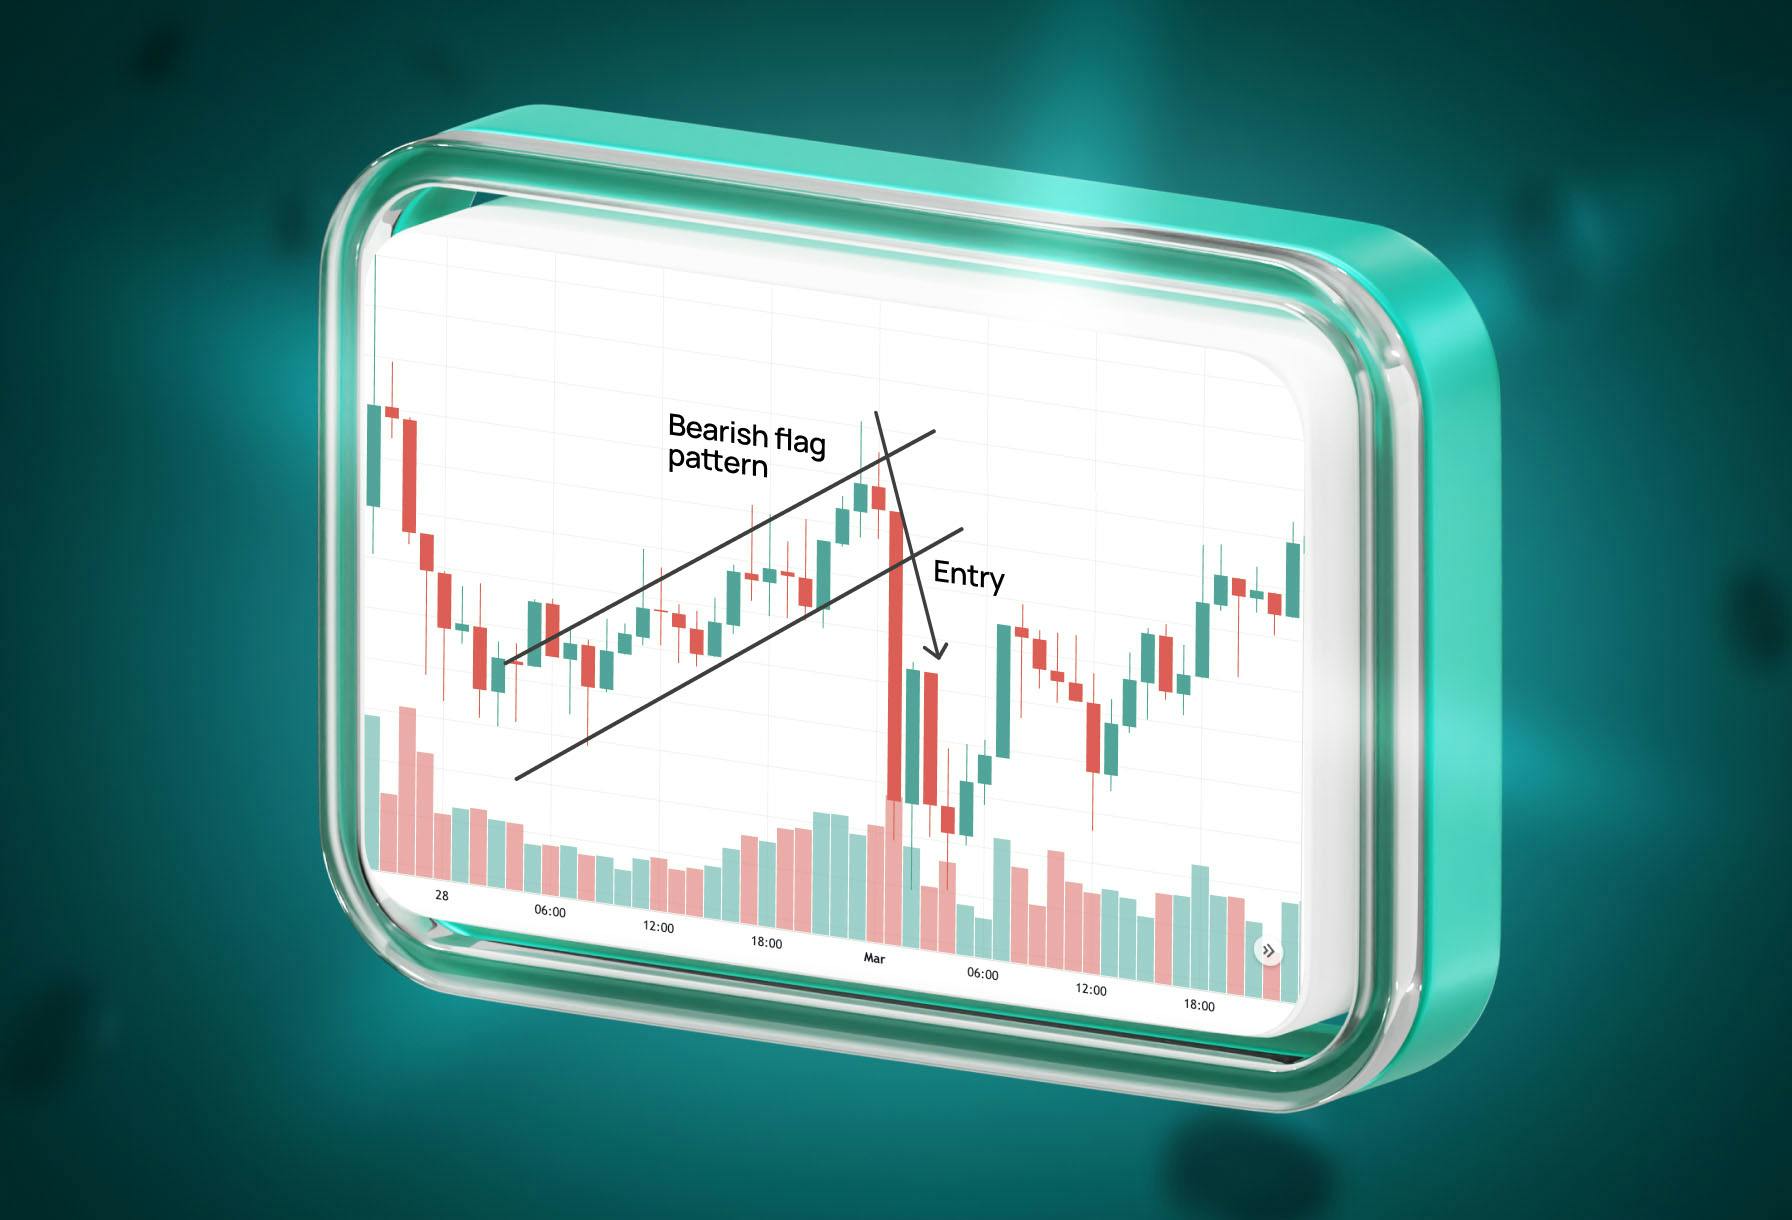
The chances are, after a sharp rise upwards or an equally sharp fall, you can expect the price to recover to normal. How can you establish this normal level? Just two words — Technical Analysis (TA). If you don't know about TA, you can subscribe to other analysts and stay tuned for updates. All you need to know is the BTC trend. A sharp downward move is an excellent opportunity to buy Bitcoin if bullish. If the trend is bearish, the price will most likely go lower. Long story short, there’s no best time of day to purchase Bitcoins. You follow the trend and do it smoothly.
Bitcoin when to buy and sell?
Is it the right time to buy Bitcoin today? You may watch out for overbought and oversold indices to find an answer. Any market, including cryptocurrency markets, has the Relative Strength Index (RSI) index.
Overbought is a situation when the price of an asset has gone well above its actual value. Keeping the price at this level is not conditioned by anything, and fewer people are willing to buy the asset at this price than those willing to sell. Respectively, in such situations, the price can fall down sharply, forming a balance in the market.
Oversold — on the contrary, when the price is lower than the one at which it's ready to be bought. For example, Bitcoin is below the cost of its mining — it's a very strong oversold (here, even miners can buy it, not mine it, because it's more profitable)
Wells Wilder introduced this indicator long ago, and it has gained popularity. Almost all technical analysis tools are based on it. The value of this indicator ranges from 0 to 100. RSI shows the speed of price change over 14 periods (14 days for daily charts, 14 hours for hourly charts, etc.).
The formula divides the average gain by the average loss then calculates the trend's strength on a customized scale from 0 to 100.
If the relative price upward is strong — you can expect to approach 100 RSI. Similarly, if the downward price movement is strong — the RSI goes to zero. To simplify, the RSI measures the "sharpness" of price movements and the difference between the recent closing trades.
When Bitcoin price goes up and updates highs, RSI has increased local lows. This means that the reference point is constantly growing. It may seem complicated, but when you start applying this indicator, you will find it quite simple.
The indicator ranges from 0 to 100, but 30 and 70 are considered essential levels.
Traders usually consider that an RSI value above 70 is an indication of overbought conditions. Ideally, you should exit a position or at least move your stops at such times. If the RSI trend is below 30, the asset is oversold. In such a situation, selling is a risk of "feeling the bottom."
Remember that no indicator gives a 100% guarantee and accuracy. They are just an additional tool for evaluating the current market. For example, the RSI may be both oversold and overbought. The price may exhibit an opposite trend and cause confusion among traders.
Imagine the RSI has grown above 70. it's an indication that the asset is overbought, and it's time to go down. If you believe in the Index, you should open a short position at such a moment. But the reality is that after the RSI crosses 70, the price can still go up. And it may show this trend for a long time and sometimes - do not return to the values at which you sold the asset. In that case, you would see red.
How can you tame this situation?
Follow the RSI on the different timeframes (TF). There is a simple rule here — the higher the TF, the higher its confidence. Weekly candles are more important than five-minute candles. The same happens when you see the prices closed higher than normal on a weekly chart.
You may want to avoid opening a position when the RSI crosses 70. You will know that the trend reverses when the Index moves downwards. That is why more often than not, no one closes a position after an up candle. Everyone is waiting for the possible continuation of the growth, shifting stops. The shorting is initiated when the RSI trendline crosses above 70 and downward. In that case, the trend line will move to the balance (values between 30 and 70). That is why the price drop in an overbought market is so sharp.
What other indices play a role in crypto?
RSI and trend indices are cool. Is there anything simpler, you may ask? The easiest way is sentiment following by means of the Fear and Greed index.
The Index analyzes trends, volatility, social media, and general market sentiment and converts that data into a single number. What information does this give an investor? You can quickly assess how the market feels — whether it's fearful or greedy. Another way is to juxtapose this indicator with yesterday's value, for example.
However, this Index lends itself to skepticism from some investors (for a good reason). Most often, at the red fear level, the price moves up, and at the green fear level, the price moves down. The golden rule for investors comes to mind: Buy when there is blood in the streets, even if it's yours. By the way, besides such fundamental and frightening indicators - there are a couple of other important points.
You can also check on the BTC hashrate. Almost each time hashrate renews ATH, Bitcoin faces a new impulse — both soaring and plummeting. More often than not, BTC shows green at such times.
Watch predictions to deepen your buying research
No expert can guarantee that the forecasts will be correct. Bitcoin is quite a volatile instrument. Let's start with the most popular estimates of 2021 from PlanB. You can find all his analytics on his Twitter.
His sensational S2F model made many people believe that Bitcoin will reach $100,000 in 2021. And while the model has failed, it's still reasonably accurate compared to other experts. According to PlanB, Bitcoin has not yet reached the top of the current bull run, and the potential for upside remains. On the other hand, you should consider that Bitcoin can fall in price. So trading using only tweets is also a bad idea.
Predicting the best time to buy Bitcoin or any other cryptocurrency remains a complex endeavor due to the inherent volatility and unpredictability of cryptocurrency markets. While advancements in market analysis and trading technologies have provided more sophisticated tools for market assessment, no method guarantees absolute accuracy. Here are a few strategies and considerations that can be taken into account:
1. Market Analysis:
- Technical Analysis: Using statistical measures and historical price data to predict future price movements. Look for established patterns and trends to identify potential buy signals.
- Fundamental Analysis: Evaluating Bitcoin’s underlying technology, its use cases, market demand, and overall adoption in the mainstream financial ecosystem.
2. Market Sentiment and News:
- Positive news about Bitcoin's adoption, regulatory clarity, or technological advancements can drive prices up.
- Keep an eye on market sentiment and global economic conditions as they can heavily influence investor behavior and market movements.
3. Dollar-Cost Averaging (DCA) with 3Commas:
- Leveraging the 3Commas DCA bot can be highly beneficial. It allows users to invest a predetermined amount in Bitcoin at regular intervals, mitigating the impact of volatility and removing the stress of timing the market. It’s a suitable strategy for those looking to accumulate Bitcoin over time without the need for constant market monitoring.
- Utilizing 3Commas DCA bot can provide a more structured and automated approach to investment, allowing users to maximize profits and manage risks effectively.
Conclusion:
Discerning the ideal time to buy Bitcoin in 2023 involves a combination of meticulous analysis, strategic planning, and effective risk management. The 3Commas platform, with its innovative DCA bot, emerges as an invaluable ally for both novice and experienced traders, enabling a more automated, strategic, and risk-mitigated approach to investing in Bitcoin. By adopting such tailored strategies and tools, investors can navigate the turbulent waters of the crypto market with enhanced confidence and precision.

A proven leader, successful at establishing operational excellence and building high-performance teams with a sharp focus on value creation and customer success.


